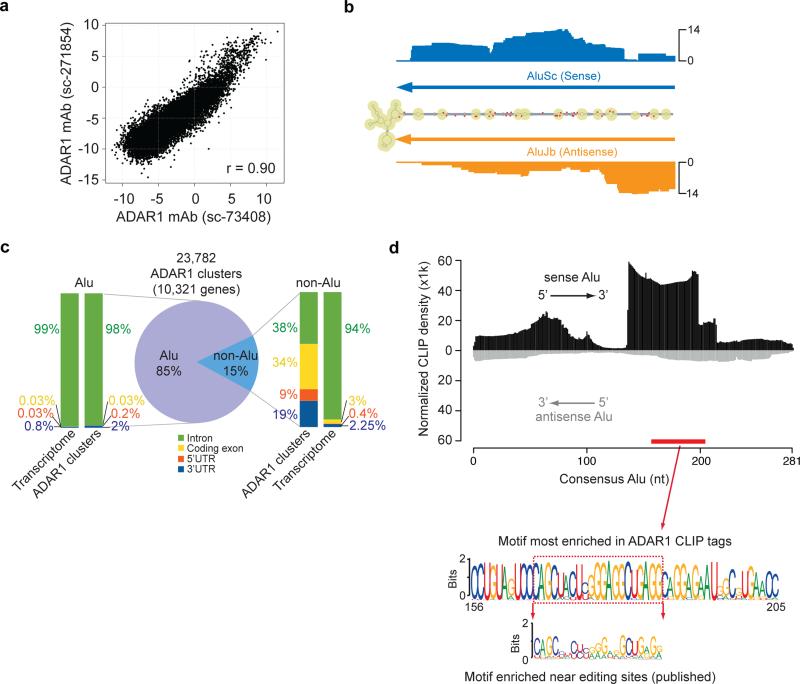
Figure 1. CLIP-Seq identifies ADAR1 binding sites in >10,000 human genes.
(a) Reproducibility of ADAR1 CLIP tags using two different antibodies. Each dot in the scatter plot represents log2 enrichment relative to the background abundance measured by polyA+ RNA-Seq for a RefSeq transcript. (b) CLIP tag distribution in the 3' UTR of the PSMB gene. The secondary structure of this region is shown as predicted by RNAfold. The number of CLIP tags is shown for each corresponding position in the folded structure, together with the location of two Alu sequences (inverted-repeats). Known editing sites (DARNED database) are labeled with red dots. (c) Genomic distribution of reproducible ADAR1 CLIP sites. Similar distribution of nucleotides in the entire transcriptome is shown as a reference. (d) Alignment of CLIP reads to the consensus Alu sequence. The CLIP tag density was normalized against expected tag density obtained from simulated reads to represent overall sequence enrichment of all the relevant Alus. Alignment to the sense Alu consensus and antisense Alu consensus was carried out separately. Given their strand-specific nature, CLIP reads were aligned to either the sense or antisense Alu unambiguously. The motif most enriched in ADAR1 CLIP tags is shown (based on an independent motif search within CLIP clusters by MEME), which is located in the sense Alu as labeled by the red bar. The motif enriched near editing sites in U87MG cells discovered previously 21 is also shown for comparison purpose.

