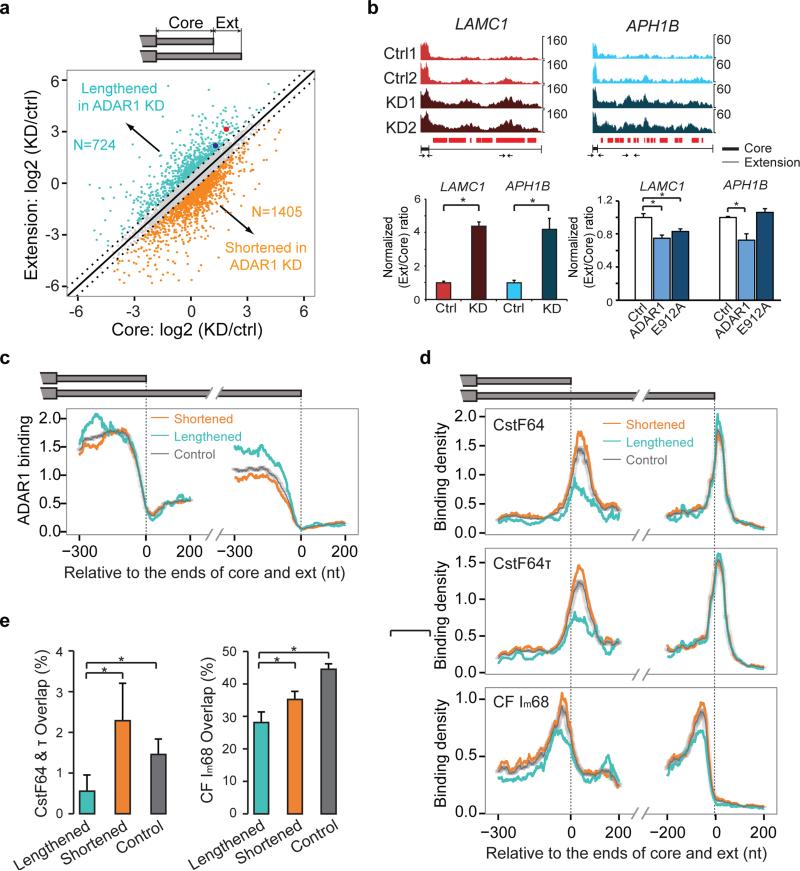
Figure 3. ADAR1 is involved in the regulation of alternative 3' UTR usage.
(a) Expression levels of core and extended (ext) regions of tandem 3' UTRs identified in RNA-Seq data. Scatter plot of their expression change upon ADAR1 knockdown (KD) in U87MG cells compared to control siRNA transfection is shown. Those with at least 41.4% change (log2-fold change > 0.5) are marked with colors. Two groups are labeled: UTRs that were lengthened in ADAR1 KD cells and the opposite. The number of 3' UTRs in each group is shown. (b) Examples of ADAR1-regulated 3' UTRs (with the two genes labeled as big red and blue dots in panel (a). Read distribution plots in two biological replicates of RNA-Seq of control (Ctrl) and ADAR1 KD experiments are shown. To compare the relative coverage of extension and core regions, read counts were normalized such that the maximum count of the core region of each gene is the same in the 4 samples. Locations covered with CLIP reads are denoted as small red bars below the RNA-Seq read distribution. Real-time PCR validation is shown with primers illustrated as small arrows (primers within core regions are enlarged in the illustration due to limited core length). Expression of extension regions was normalized by that of the core region. The ratios were further normalized such that controls have a value of 1. Mean ± SD is shown for six biological replicates. *p < 0.05 (Wilcoxon Rank-Sum test). (c) Mean ADAR1 CLIP density near the 3' end of core and extension regions in the two groups as defined in (a). CLIP density was normalized using gene expression levels (RPKMs) derived from RNA-Seq data. Similarly normalized density in control 3' UTRs is shown. The controls (gray dots in (a)) were randomly picked to match the RPKM values of the regulated 3' UTRs. 95% confidence intervals are shown for the control curves that were calculated using 100 sets of randomly constructed, RPKM matched controls. (d) Mean CLIP density near the 3' end of core and extension regions of the same 3' UTR groups as in (c). The density was normalized in the same way as described in (c). The controls were again randomly picked to match the RPKM values of the regulated 3' UTRs. RNA-Seq data of HEK 293 cells (same cell type as for the CLIP data shown here) were used to calculate gene-level RPKM. (e) Percent overlap between ADAR1 targets and targets of the CstF74 & τ and CFIm68 calculated relative to the number of ADAR1 targets in the “lengthened”, “shortened” (as defined in (a)) and controls (gray dots in (a)). P values (*p < 0.05) were calculated by proportion tests and the error bars show the 95% confidence intervals. The number of samples in each group is illustrated in (a).

