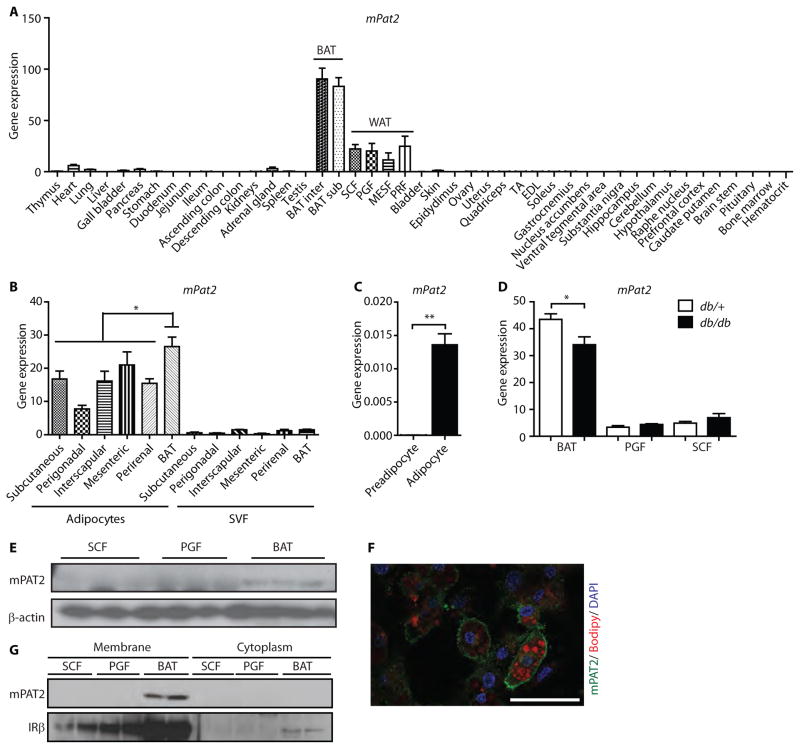
Fig. 2. PAT2 is a cell surface marker of mouse brown adipocytes.
(A) mPAT2 expression data from 45 tissues of 7-week old C57BL/6 mice normalized to TBP. Data are means ± SEM (n=3 mice). (B) mPat2 expression in freshly isolated adipocytes and their corresponding SVF from different mouse fat depots. Data are means ± SEM (n=4 mice; * p<0.05 One-Way ANOVA with Tukey’s multiple comparison test). (C) mPAT2 expression in immortalized murine brown preadipocytes and fully differentiated adipocytes. Data are means ± SEM (n=3 mice; ** p<0.01, two tailed unpaired t-test). (D) PAT2 expression in subcutaneous, perigonadal and brown adipose tissue of db/db and control (db/+) mice, normalized to TBP. Data are means ± SEM (n=6 mice per group; * p<0.05, two tailed unpaired t-test). (E) Western blots for mPAT2 of SCF, PGF and BAT. β-actin was used as loading control. The membrane was stripped and reused in figures 1G and 3E, showing the same loading control. (F) Immunofluorescent staining of mPAT2 of differentiated brown adipocytes from immortalized SVF, co-stained with the lipid dye Bodipy and nuclear dye DAPI. Scale bar, 50 μm. (G) Western blot of membrane extracts and the corresponding cytoplasmic fractions of SCF, PGF and BAT.

