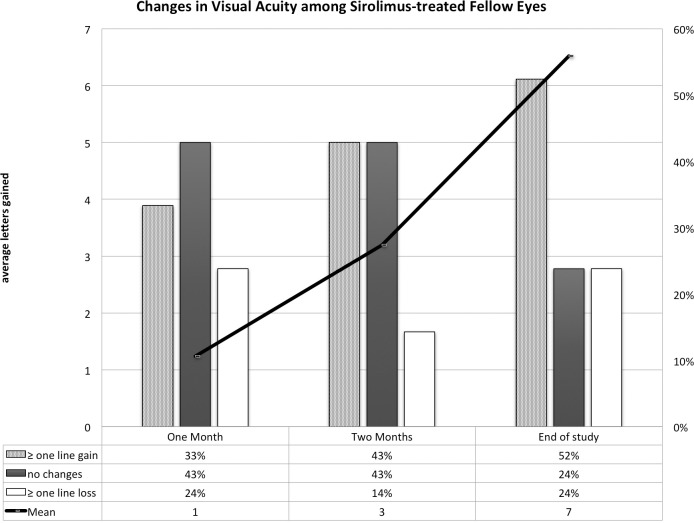
Figure 6. .
Changes in VA in the fellow eyes that received sirolimus at 1 and 2 months following the first injection of sirolimus and at the end of the follow-up period (month 12). The line represents the changes in the mean VA as measured by the ETDRS letters and the columns represent the proportions of patients who gained one or more lines of VA compared with those who lost one or more lines.

