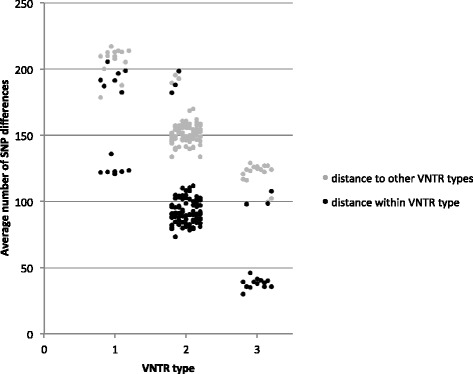
Figure 3.

Scatter plot of the average pairwise SNP distance, as determined by the maximum likelihood distance matrix, between each MAP isolate within INMV 1, INMV 2, and INMV 3 (black) and between those VNTR types and isolates of all other VNTR types identified in this study (grey) based on 8 VNTR loci.
