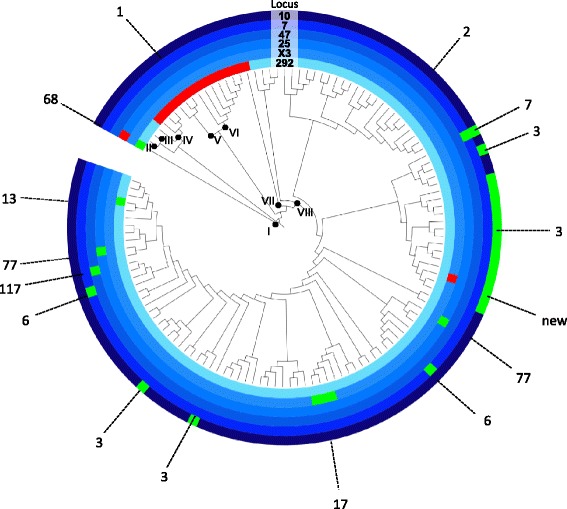
Figure 4.

Circularized maximum likelihood phylogenetic tree with each polymorphic VNTR locus concentrically displayed (inner to outer: 292, X3, 25, 47, 7, and 10). Branch lengths are not shown to scale. Blue represents the most common repeat number within each locus, red indicates a larger repeat number, and green represents a smaller repeat number. A dotted line indicates the VNTR type that represents each locus combination and the subtype (I-VIII) of each isolate/clade is indicated by a black dot located at the ancestral node of the isolate(s) within that subtype.
