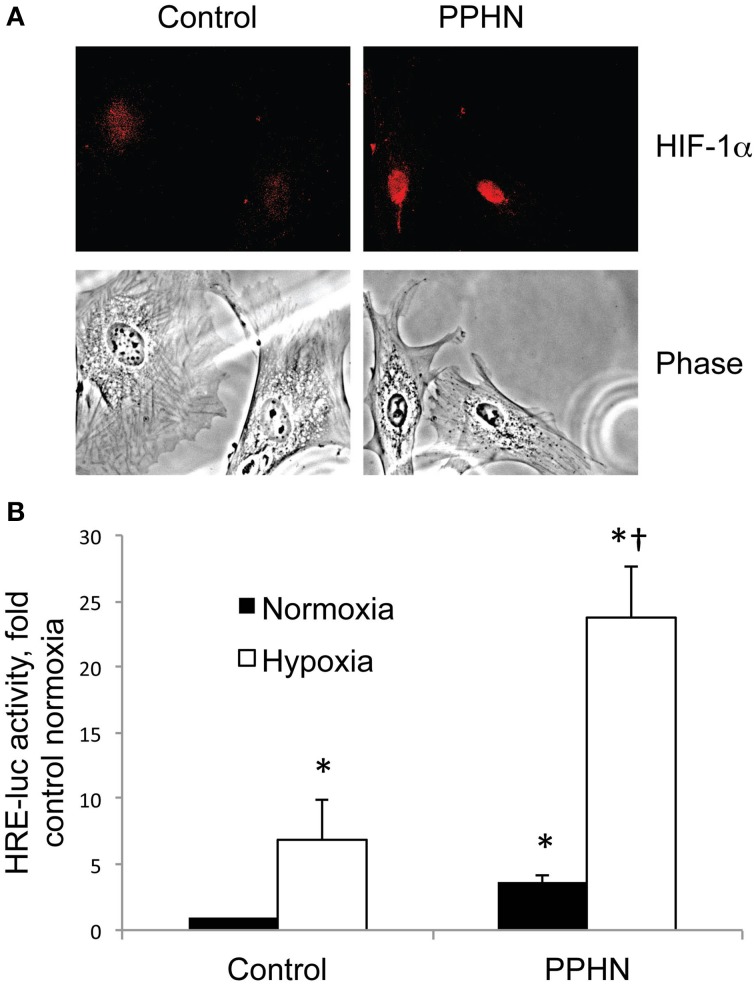
Figure 2.
HIF-1α nuclear expression and activity is increased in PPHN PASMC (A) Representative immunocytochemistry images from control and PPHN PASMC depicting nuclear localization of HIF-1α and the corresponding light phase image. (B) Control and PPHN PASMC were transfected with a plasmid containing four consensus HRE sequences upstream of a luciferase reporter (HRE-luc). Cells were maintained in normoxia or exposed to 1.5% O2 for 24 h before assay. Relative light units were determined in a luminometer, normalized to an internal renilla luciferase control plasmid and expressed as fold change relative to control cell lysates. *p < 0.05 vs. control normoxia; †p < 0.05 vs. control hypoxia and PPHN normoxia. N = 4.

