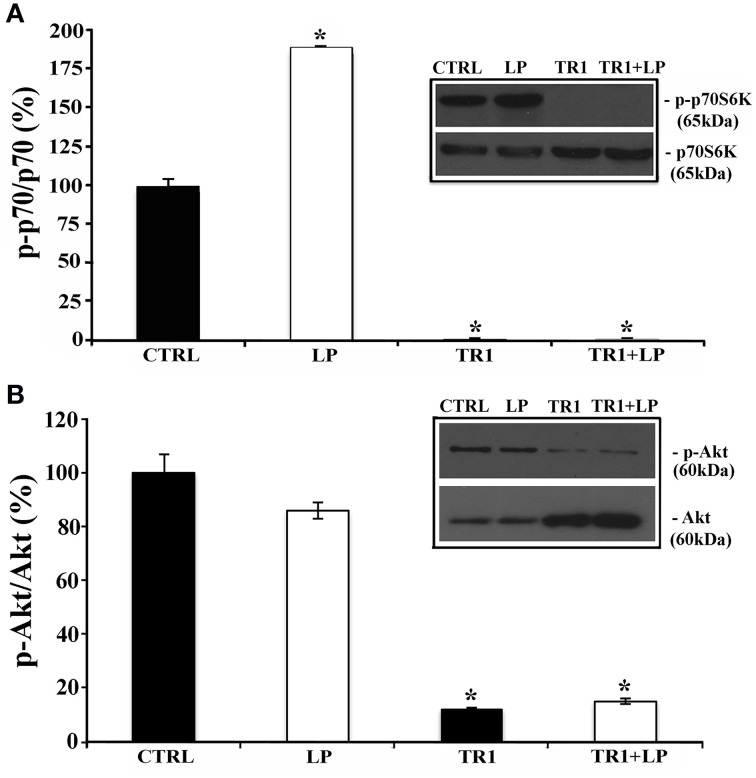
Figure 3.
Stimulation of 5-HT7R activates mTORC1 signaling. Cortical neurons were treated for 2 h with the 5-HT7R selective agonist LP-211 (LP, 100 nM), or the mTOR inhibitor torin 1 (TR1, 250 nM), alone or in combination. (A) The bars show the level of p70S6K phosphorylation at Thr389 (means ± SEM, n = 6), expressed as percentage of values measured in the corresponding vehicle-treated cultures (CTRL, set to 100%). The level of p70S6K phosphorylation was measured by Western blot as intensity of p70S6K phosphorylated at Thr389 (p-p70S6K) normalized with that of total (phosphorylated and unphosphorylated) p70S6K in the same samples. The inset displays representative blots probed with antibodies against p-p70S6K and p70S6K; the molecular weights (kDa) are shown on the right. (B) The bars show the level of Akt phosphorylation at Ser473 (means± SEM, n = 3), expressed as percentage of values measured in the corresponding vehicle-treated cultures (CTRL, set to 100%). The level of Akt phosphorylation was measured by Western blot as intensity of Akt phosphorylated at Ser473 (p-Akt) normalized with that of total Akt (Akt) in the same samples. The inset displays representative blots probed with antibodies against p-Akt and Akt; the molecular weights (kDa) are shown on the right. Asterisk (*): value significantly different from CTRL by One Way ANOVA followed by Dunnett post-hoc test (p < 0.05).

