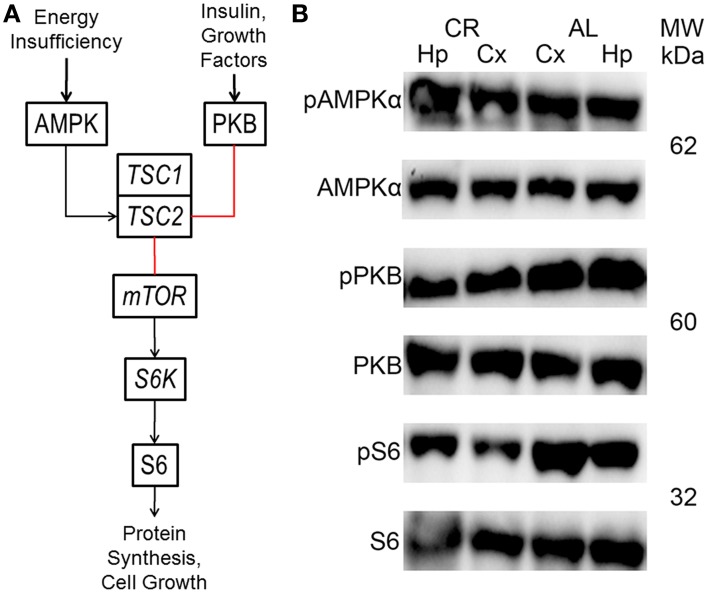
Figure 4.
(A) Brief diagram of the mechanistic target of rapamycin (mTOR) pathway with analyzed proteins/genes (black arrows, activation; red lines, inhibition; AMPK, adenosine monophosphate-activated protein kinase; PKB, protein kinase B; TSC1, tuberous sclerosis 1; TSC2, tuberous sclerosis 2; S6K, ribosomal protein S6 kinase; S6, ribosomal protein S6). (B) Representative blots showing both phosphorylated (p) and total AMPK, PKB and S6 in the neocortex (Cx) and hippocampus (Hp) of rats fed ad libitum (AL) or subjected to 15% caloric restriction (CR). The molecular weight (MW) is shown in kilodaltons (kDa) to the right of each protein pair.

