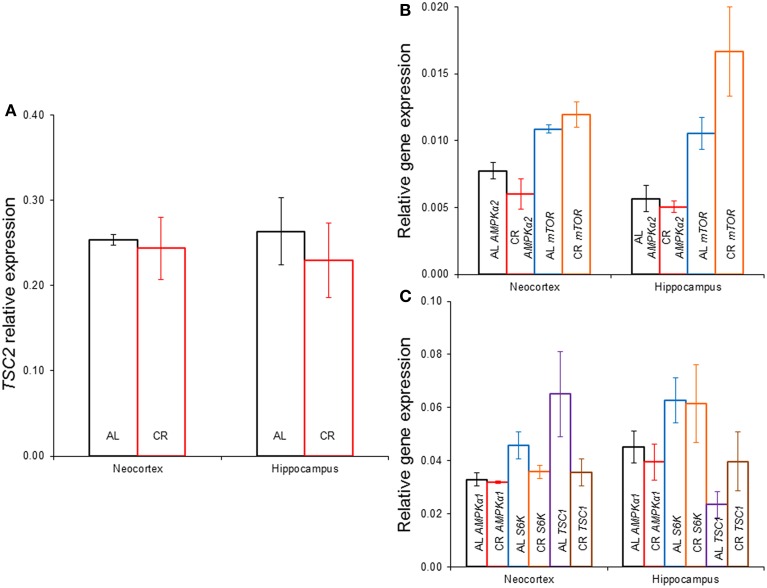
Figure 6.
Gene expression in the neocortex and hippocampus of rats fed ad libitum (AL) or exposed to 15% caloric restriction (CR). (A) Comparison of tuberous sclerosis 2 (TSC2), (B) Semi-quantitative levels of the α2 catalytic subunit of the adenosine monophosphate-activated protein kinase (AMPK) and the mechanistic target of rapamycin (mTOR) genes, (C) Relative level of the α1 catalytic subunit of AMPK, ribosomal protein S6 kinase (S6K) and TSC1 genes. There were no significant differences between the groups.

