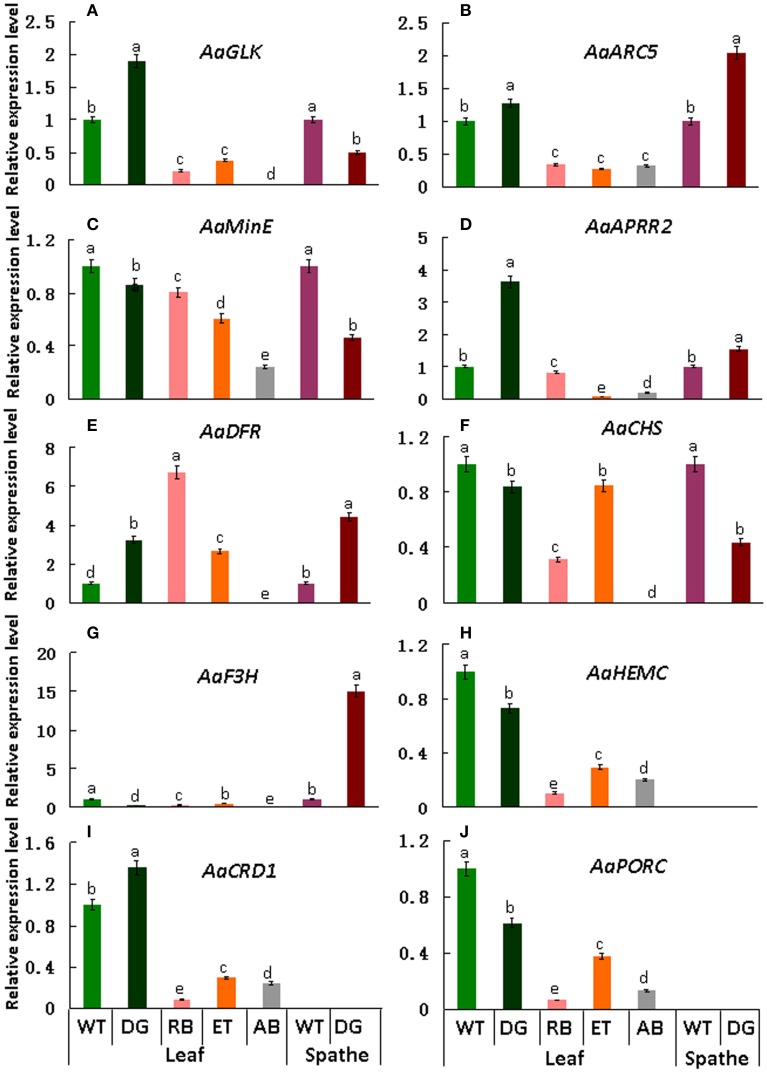
Figure 9.
qRT-PCR expression analysis of genes involved in chloroplasts development, division and pigment biosynthesis in different tissues in the wild type Anthurium and 4 leaf color mutants. In these pictures, WT, Wild type; DG, dark green; RB, rubescent; ET, etiolated; AB, albino. (A) the relative expression level of AaGLK; (B) AaARC5; (C) AaMinE; (D) AaAPRR2; (E) AaDFR; (F) AaCHS; (G) AaF3H; (H) AaHEMC; (I) AaCRD1; (J) AaPORC. Different small letter with in lines indicate significant difference by LSD's multiple range test at 5% level in the leaves and spathes, respectively.

