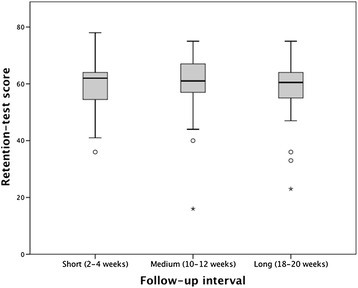
Figure 2.

Retention-test scores for the short, medium and long follow-up groups. Box-plot representation of the retention-test scores for the short, medium and long follow-up groups. Each plot shows the median (centred vertical line), the middle 50% of the test scores (box), the highest and lowest score (top and bottom vertical lines) and outliers (dots and stars). As evident from the plot, there were no statistically significant differences in retention-test score between the three groups.
