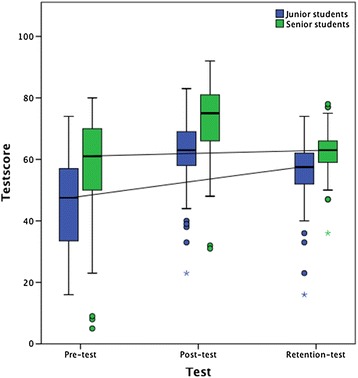
Figure 3.

Improvement in test score between pre-test and retention-test for junior and senior students. Box-plot representation of the pre-test, post-test and retention-test scores for junior and senior students. Each plot shows the median (centred vertical line), the middle 50% of the test scores (box), the highest and lowest score (top and bottom vertical lines) and outliers (dots). The transverse lines that connect the pre-test and retention-test medians depict the improvement between pre-test and retention-test (pooled follow-up interval of 2–20 weeks). As evident from the plot, the overall improvement was greater among the junior students.
