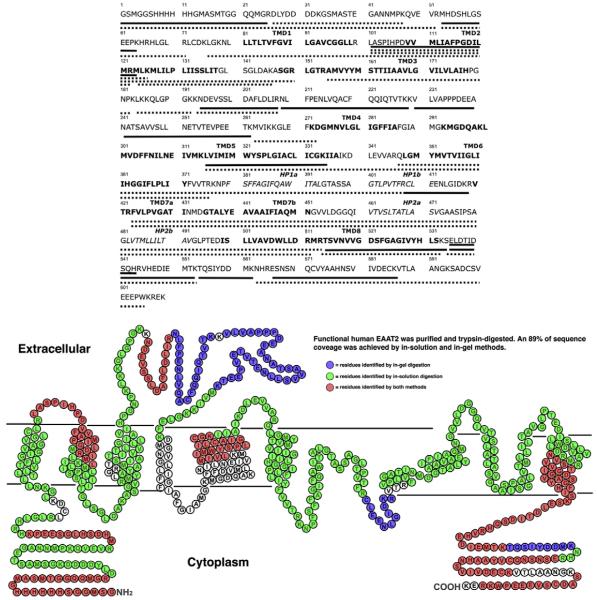
Fig. 1.
Upper image: Amino acid sequence of the N-terminal 6×HIS-tagged human EAAT2. The transmembrane domains are marked in bold and the hairpin loops are marked in italic. Solid lines represent regions identified by in-gel digestions, dotted lines represent regions identified by in-solution digestions (corresponding to Table 1). Lower image: Sequence coverage of hEAAT2 by MALDI-TOF MS analysis aligned to secondary structure predictions derived from sequence alignment of hEAAT2 against crystal structure of GltPh [23] (PDB entry: 2NWW). Amino acids identified in in-gel and in-solution analyses are labeled in blue and green, respectively. Peptide fragments identified by both methods are labeled in red. (For interpretation of the references to colour in this figure legend, the reader is referred to the web version of this article.)

