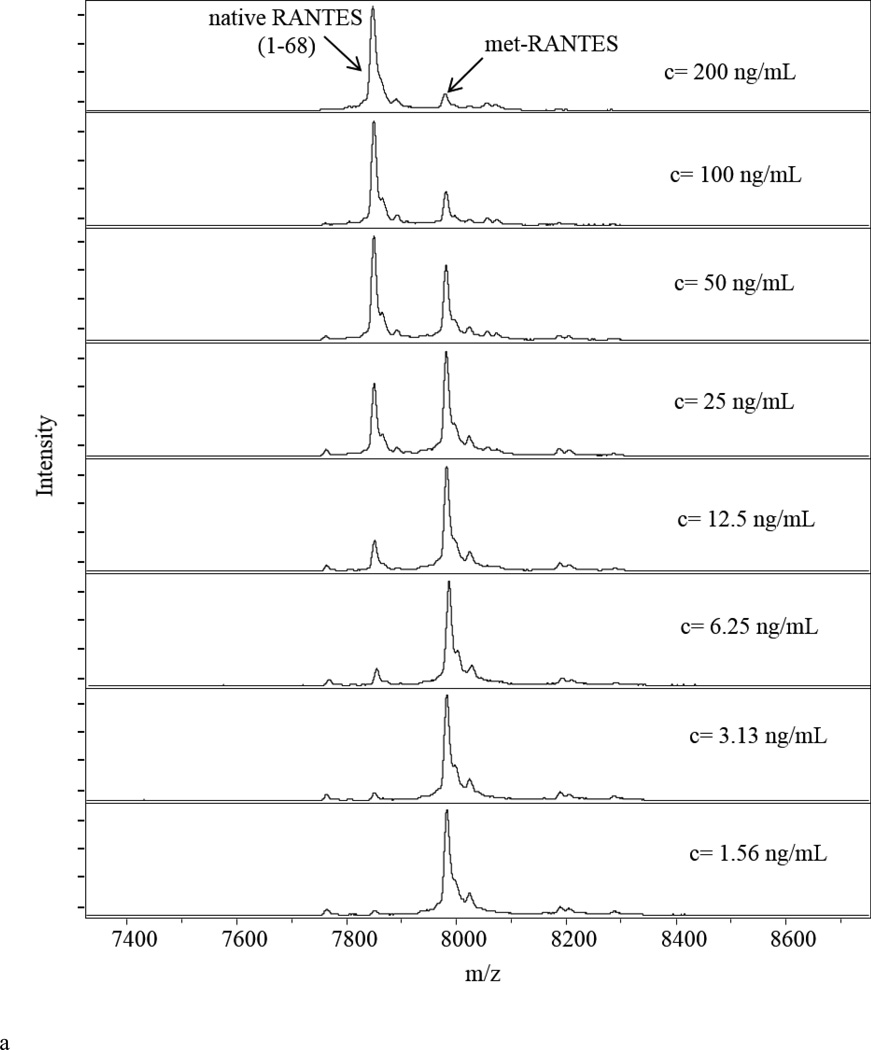
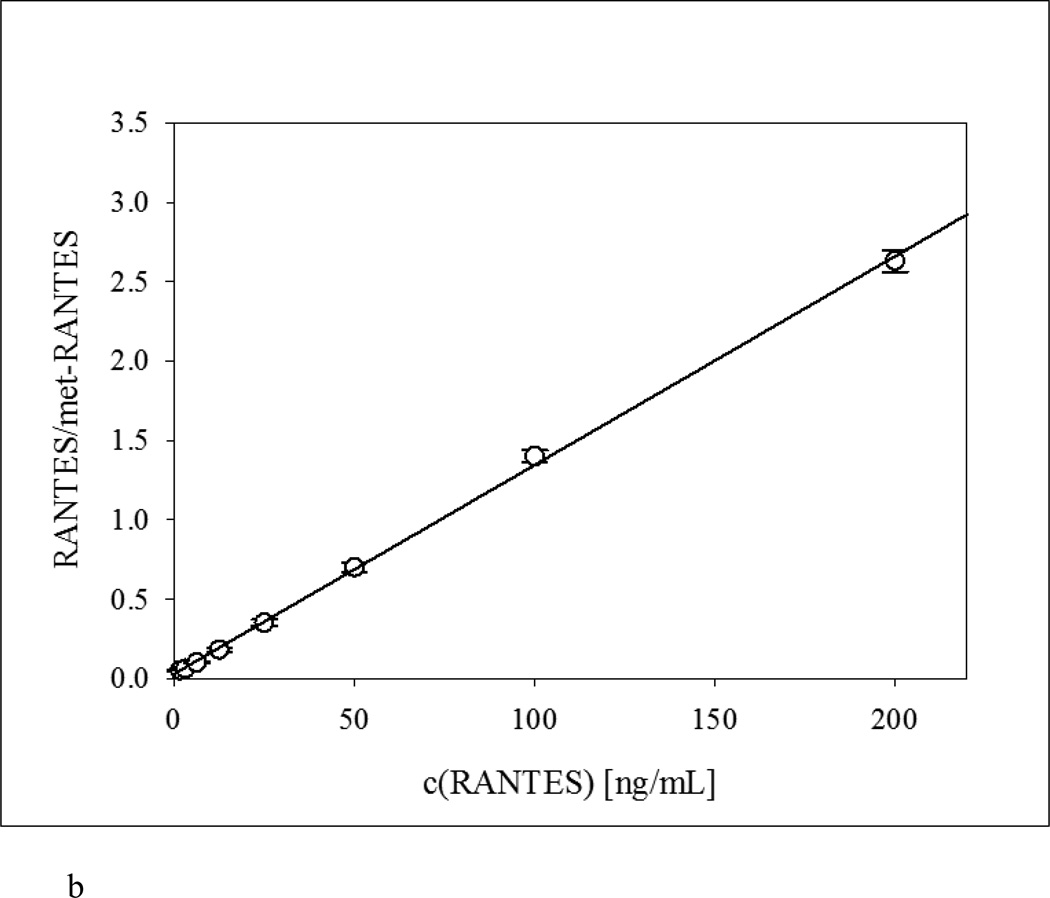
Figure 1.
Quantitative RANTES mass spectrometric immunoassay (MSIA). a) Representative RANTES MSIA mass spectra for the eight standard RANTES samples containing met-RANTES as an IRS; b) Representative standard curve generated with the RANTES MSIA, with an r2 = 0.9992, and standard error of estimate (SEE) of 0.0278.


