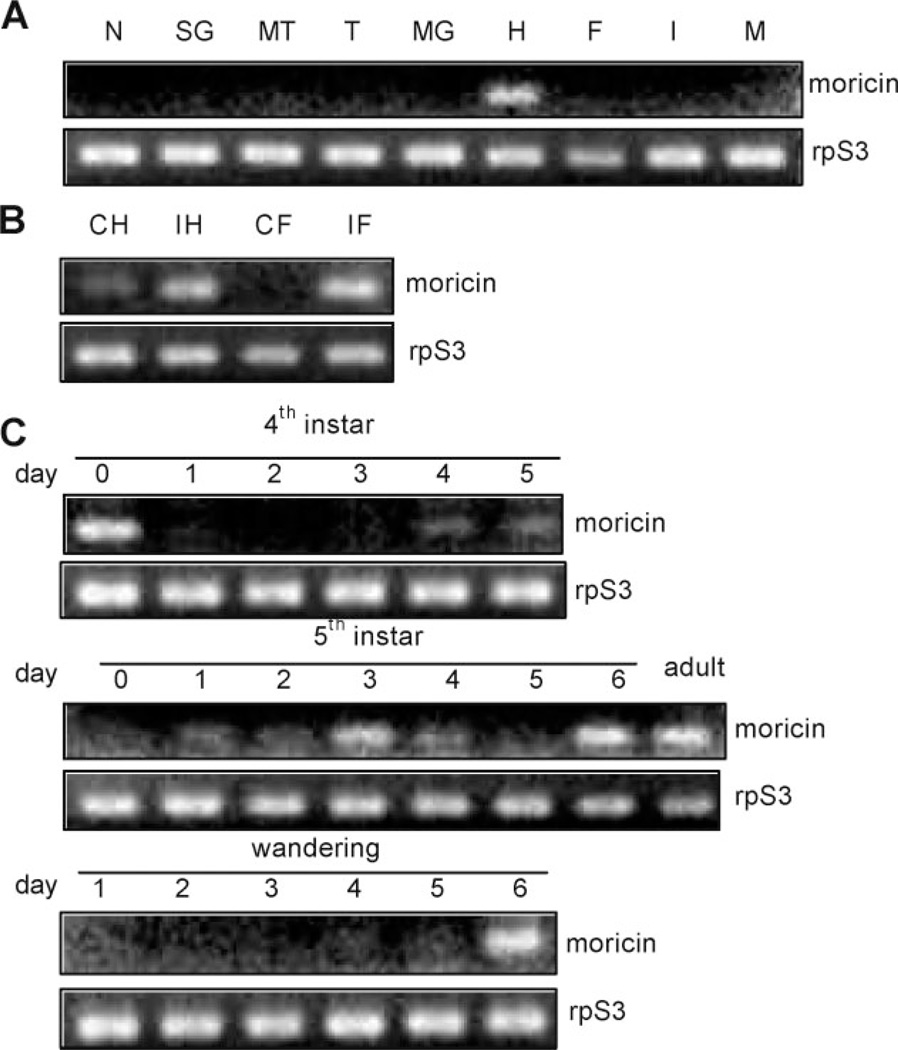
Figure 1.
Profiling of M. sexta moricin transcript levels by reverse transcription-PCR. (A) Expression in different tissues from day 3, 5th instar naïve larvae. N, nerve tissue; SG, salivary gland; MT, Malpighian tubule; T, trachea; MG, midgut; H, hemocytes, F, fat body; I, integument; M, muscle. (B) Induced transcription in hemocytes (H) and fat body (F) from naïve (C) and bacteria-injected (I) larvae. (C) mRNA level changes in fat body from insects at different developmental stages.

