Figure 1.

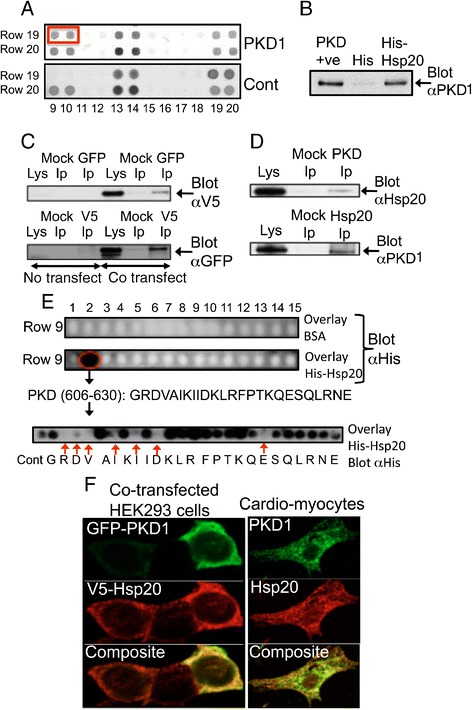
PKD1 and Hsp20 form a signaling complex in cardiac myocytes. A. ProtoArray Human Protein Microarray screen identified PKD1 as an interacting partner for Hsp20 (top panel, compared to control, bottom panel). B. In vitro pull-down assay showed that recombinant His-Hsp20, but not control His-tag, co-purifies with PKD1. C. Overexpressed Hsp20-V5 and GFP-PKD1 co-immunoprecipitate when expressed in HEK293 cells. D. Endogenous Hsp20 and PKD1 from cardiac myocyte lysate co-immunoprecipitate. Mock IP represents respective IgG only. Data representative of n = 3 independent experiments. E. Peptide array analysis identifies Hsp20 binding site within the catalytic domain of PKD1 (G606-E630). F. Overexpressed Hsp20-V5 and GFP-PKD1 co-localise in HEK293 cells and endogenous Hsp20 and PKD1 co-localise in cardiac myocytes. Pearson’s coefficient for Hsp20 and PKD1 is shown along with Manders’ coefficients (M1 and M2), which represent the fraction of the Hsp20 red overlapping with PKD1 green and the fraction of PKD1 green overlapping with the Hsp20 red, respectively. The results are shown as means ± SEM of several images where at least 10 individual cells were analysed for each coefficient.
