. 2014 Nov 4;3:e04207. doi: 10.7554/eLife.04207

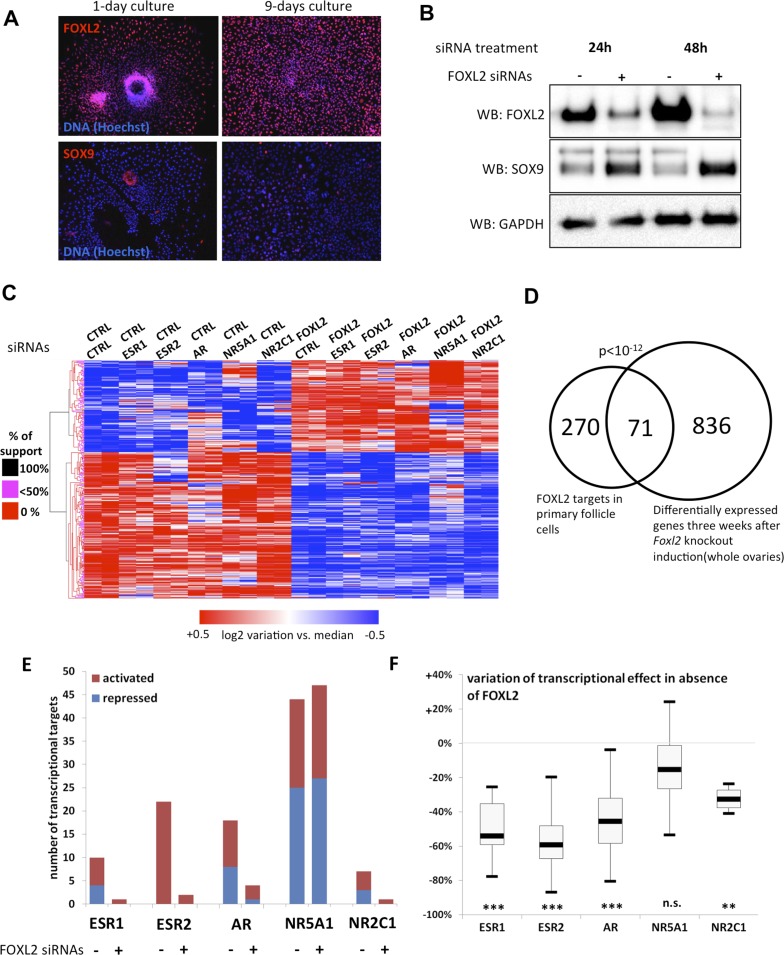
Figure 1. FOXL2 and nuclear receptor transcriptional targets in primary follicular cells.

(A) Analysis by immunofluorescence of FOXL2 and SOX9 expression in primary murine granulosa cells cultured for either 1 day or 9 days. FOXL2 and SOX9 are stained in red, whereas DNA was counterstained with Hoechst 33342 (blue). These micrographs show that FOXL2 expression remains strong and homogenous in 9-day granulosa cell cultures, whereas SOX9 is slightly upregulated. (B) Western blot analysis of FOXL2 and SOX9 expression in 9-day cultured murine granulosa cells treated with a control siRNA or with anti-FOXL2 siRNAs for 24 or 48 hr. GAPDH was used as a loading control. This panel shows that FOXL2 is required for Sox9 repression in these cells, as SOX9 expression increases quickly following Foxl2 knockdown. (C) Heatmap representation of the relative expression values of FOXL2 targets in various conditions (biological duplicates). A bootstraped hierarchical clustering was performed and the dendrogram is represented on the left. The clustering discriminates with 100% of support two main groups of FOXL2-activated targets, and two groups of FOXL2-repressed targets (detailed below). (D) Venn Diagram representing the intersection of FOXL2 targets in our data with genes whose expression is modified 3 weeks after Foxl2 conditional knockout in granulosa cells (in vivo). The intersection is composed of genes affected in the same direction in both studies. (E) Number of activated or repressed targets of the indicated NRs in the presence of FOXL2 (i.e., control siRNA) or in its absence (i.e., when comparing to conditions where anti-FOXL2 siRNAs were used). (F) Boxplot of the variation (in %) of the transcriptional effect of the indicated NRs on its target genes (defined according to the inclusion criteria explained in the main text), when Foxl2 was knocked down compared to control conditions. This variation was calculated for each target gene of the indicated NR. The extreme points represent the 5th and 95th percentiles, whereas the box represents the 25th to 75th percentiles, with the median indicated in black. Statistical significance of the observed differences with the null hypothesis (reference value of 0) in a one-sample t test: n.s. non significant; **p < 0,01; ***p < 0,0001.

DOI: http://dx.doi.org/10.7554/eLife.04207.003

Figure 1—source data 1. This file contains all Log2 transcriptional effects and transcriptional targets analyzed in Figure 1, which were calculated as indicated in methods.
The different tabs contain respectively (all Log2 transcriptional effects, list of FOXL2 targets, list of FOXL2 ‘in vivo’ targets, list of ESR1 targets, list of ESR2 targets, list of AR targets, list of NR5A1 targets, list of NR2C1 targets, list of AR targets in the absence of FOXL2, and list of NR5A1 targets in the absence of FOXL2). Red indicates activated transcriptional targets (more than twofold). Dark blue indicates repressed transcriptional targets (more than twofold). Orange indicates activated targets (between 1.5-fold and twofold). Light blue indicates repressed transcriptional targets (between 1.5-fold and twofold).
elife04207s001.xlsx (3.2MB, xlsx)
DOI: 10.7554/eLife.04207.004

Figure 1.

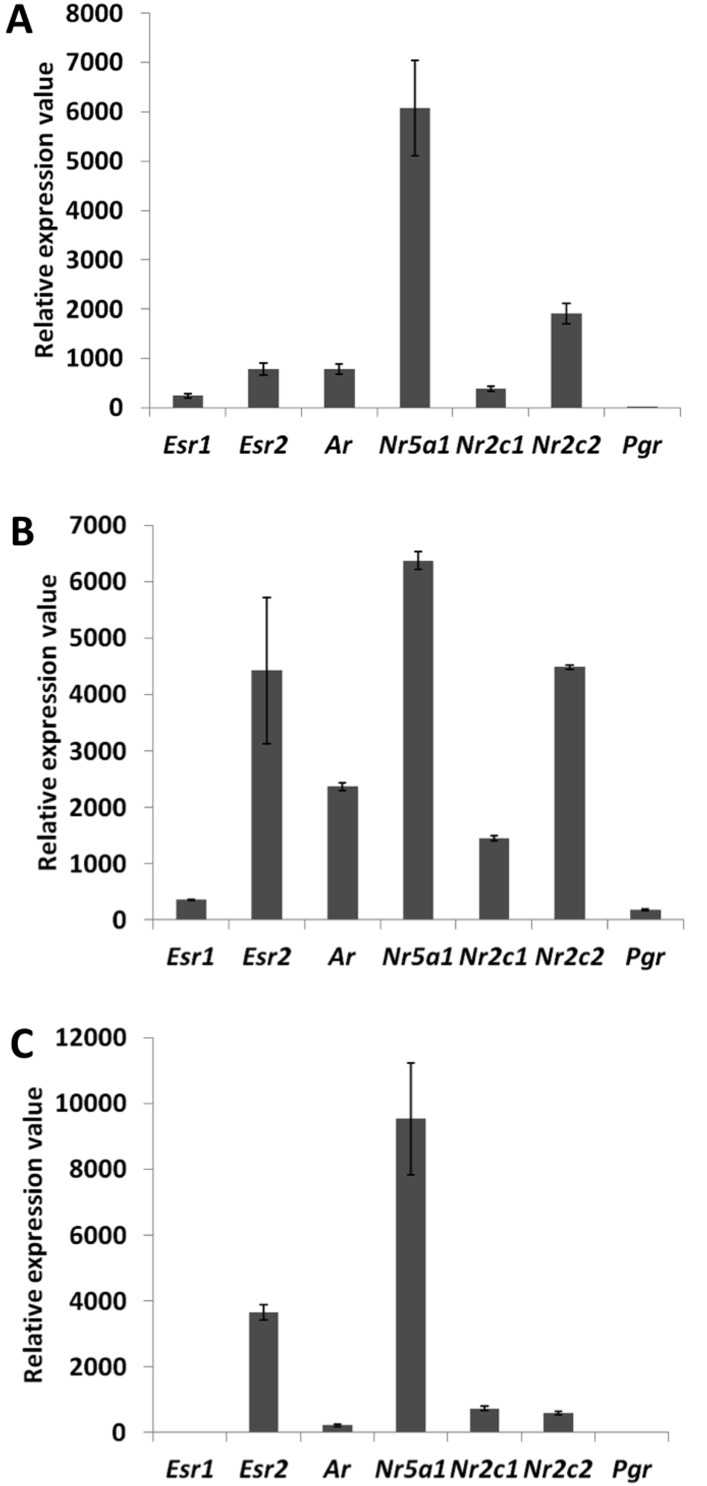
Figure 1—figure supplement 1. Detection and quantification of various nuclear receptors in primary follicle cells.

Figure 1—figure supplement 1.

Evaluation of the expression levels of Esr1, Esr2, Ar, Nr5a1, Nr2c1, Nr2c2, and Pgr in 9-day primary follicular cells with qPCR (A) or microarray data on a Nimblegen (B) or Agilent (C) platform. For (A), qPCR was carried out using cDNAs at various concentrations in order to evaluate the precise efficiency of each amplicon. The relative expression levels were then deduced from the average of six data points. For (B) and (C), the bar represents the average fluorescence values measured in the control conditions (i.e., cells treated only with control siRNAs).
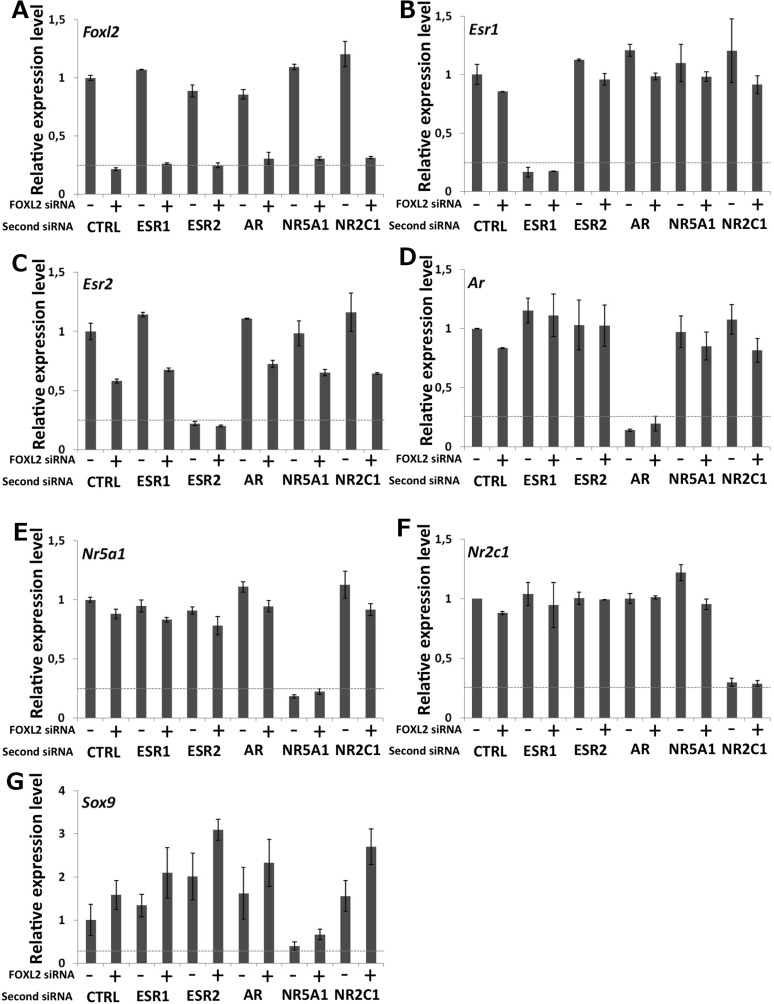
Figure 1—figure supplement 2. Characterization of siRNA efficiency for microarray analysis.

Figure 1—figure supplement 2.

Relative amounts of Foxl2 (A), Esr1 (B), Esr2 (C), Ar (D), Nr5a1 (E), Nr2c1 (F), and Sox9 (G) cDNAs prepared from 9-day primary follicular cells treated with the indicated siRNAs, determined by qPCR. Relative expression levels were normalized by the average expression level of Actb and Sdha and are expressed as relative values with respect to the expression level in the control condition. Error bars represent the standard deviation of two biological duplicates. The experiment was repeated twice with consistent results. The dotted line represents 25% of the expression level in the control condition. This shows that each of the targeted mRNA is reduced by at least 70% in the presence of the corresponding siRNA pool. Sox9 mRNA level is maximally increased when Foxl2 and Esr2 are knocked down and decreased when NR5A1 is knocked down.