. 2014 Oct 23;3:e03766. doi: 10.7554/eLife.03766

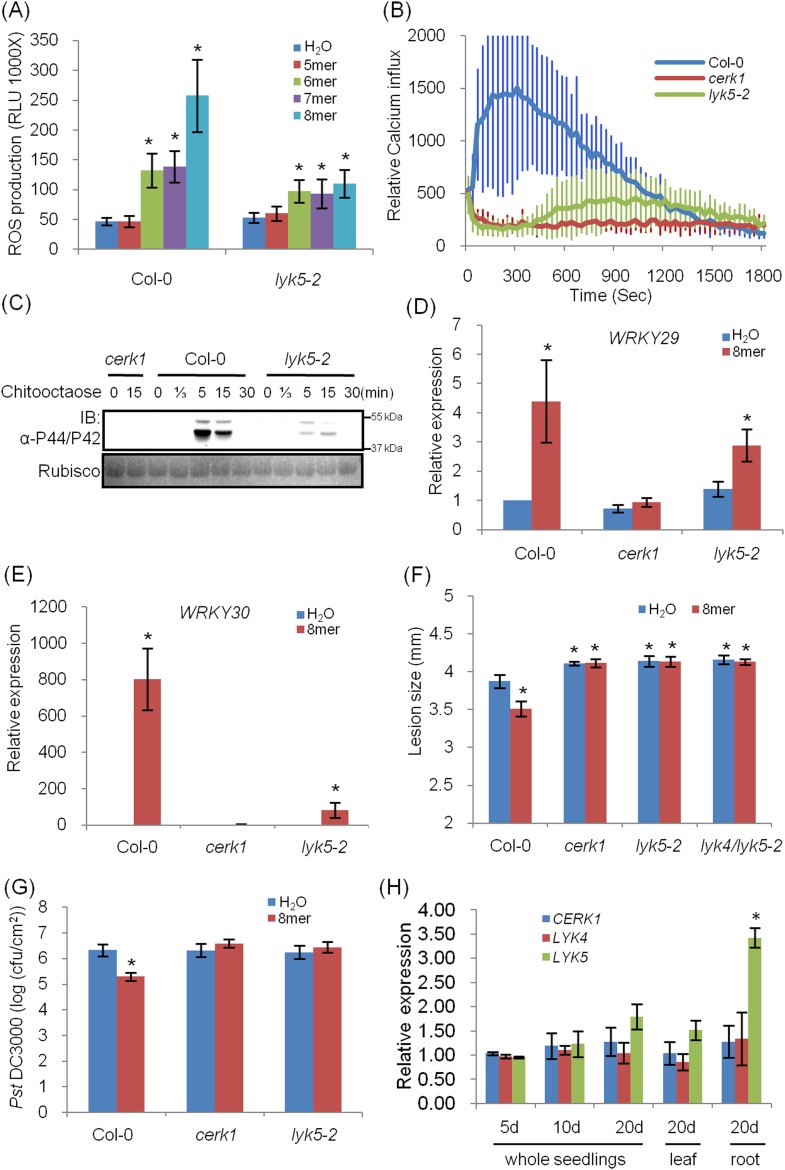
Figure 1. Atlyk5 mutant plants are defective in chitin-triggered immune responses.

(A) ROS production was measured from Col-0 wild-type and Atlyk5-2 mutant plants for 30 min after treatment with different chitin oligomers. 5mer: chitopentaose, 6mer: chitohexaose, 7mer: chitoheptaose, and 8mer: chitooctaose. Data are mean ± SE (n = 8). Asterisks indicate significant difference relative to H2O treated Col-0 wild-type plants. (p < 0.01, Student's t test). (B) Calcium influx in the wild-type, Atcerk1 and Atlyk5-2 mutant plants expressing aequorin was recorded for 30 min after chitooctaose treatment. (C) MAP kinase phosphorylation after chitooctaose treatment was detected by immunoblot using anti-P44/P42 antibody. (D) AtWRKY29 (At4g23550) and (E) AtWRKY30 (At5g24110) gene expression was analyzed using qRT-PCR in the wild-type, Atcerk1 and Atlyk5-2 mutant plants with or without treatment with chitooctaose, 8mer. UBQ10 (At4g05320) was used a control. Data are mean ± SE (n = 3). Asterisks indicate significant difference relative to H2O treated Col-0 wild-type plants. (p < 0.01, Student's t test). (F) 4-week-old leaves from Col-0 wild-type, Atcerk1, Atlyk5-2, and Atlyk4/lyk5-2 mutant plants were inoculated with Alternaria brassicicola 24 hr after hand-infiltration with H2O or 1 µM chitooctaose. The diameter of the lesion area was measured 4 days after inoculation. Data are mean ± SE (n = 12). Asterisks indicate significant difference relative to H2O treated Col-0 wild-type plants. (p < 0.05, Student's t test). (G) Leaf populations of Psuedomonas syringae pv. tomato DC3000 3 days after inoculation. 4-week-old plants were either pretreated with H2O or 1 µM chitooctaose 24 hr before inoculation with P. syringae. Data are mean ± SE (n = 9). Asterisk indicates T-test significant difference compared with H2O-treated Col-0 plants at p < 0.05, Student's t test. (H) AtCERK1, AtLYK4 and AtLYK5 gene expression in different plant ages and plant tissue. RNA from whole seedling of 5 day, 10 day, 20 day old plants and leaf and root tissues from 20 day old plants were used for reverse transcript and qRT-PCR was performed using specific primers. Data are mean ± SE (n = 3). Asterisks indicate significant difference relative to chitiooctaose treated Col-0 wild-type plants (p < 0.01, Student's t test).

DOI: http://dx.doi.org/10.7554/eLife.03766.003

Figure 1.

Figure 1—figure supplement 1. Arabidopsis LYK gene family.

Figure 1—figure supplement 1.

A complete alignment based on the full-length sequences of each protein was used to draw the phylogenetic tree using Clustal X software. AtCERK1: At3g21630, AtLYK2: At3g01840, AtLYK3: At1g51940, AtLYK4: At2g23770, AtLYK5: At2g33580.
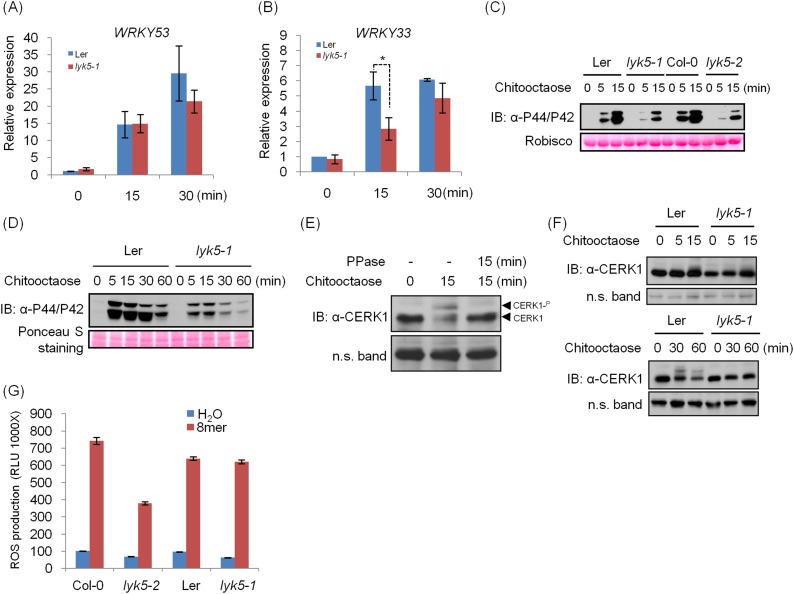
Figure 1—figure supplement 2. Chitin response in Ler lyk5-1 mutant plants.

Figure 1—figure supplement 2.

(AB) WRKY53 gene (A) and WRKY33 gene (B) expression was analyzed using qRT-PCR in Ler wild-type and Atlyk5-1 mutant plants with or without treatment with 1 µM chitooctaose. 8mer: chitooctaose. Data are ± SE (n = 3), *p < 0.05. (CD) MPK phosphorylation in Ler wild-type and Atlyk5-1 mutant plants revealed by immunoblot. Leaf discs from 5-week-old plants (C) or 2-week-old seedlings (D) were subjected to the treatment with 1 µM chitooctaose for the time point shown in figures. Lower panel shows similar loading of total protein. (E) Chitin induces AtCERK1 phosphorylation. Mature leaves from Col-0 wild type plants were hand-infiltrated with 1 µM chitooctaose or H2O as control for 15 min. All samples were incubated with antarctic phosphatase or H2O as control at 37°C for 15 min. Anti-AtCERK1 antibody was used to detect AtCERK1 protein. (F) AtCERK1 phosphorylation in Ler wild-type and Atlyk5-1 mutant plants revealed by immunoblot using anti-AtCERK1 antibody after hand-infiltration with 1 µM chitooctaose for the time points shown in figures. (G) ROS production was measured from the Ler wild-type plants, Atlyk5-1 mutant plants, Col-0 wild-type plants, Atlyk5-2 mutant plants for 30 min after treatment with 0.5 µM chitooctaose. Data are mean ± SE (n = 6). Asterisk indicates significant difference. (p < 0.01, Student's t test).
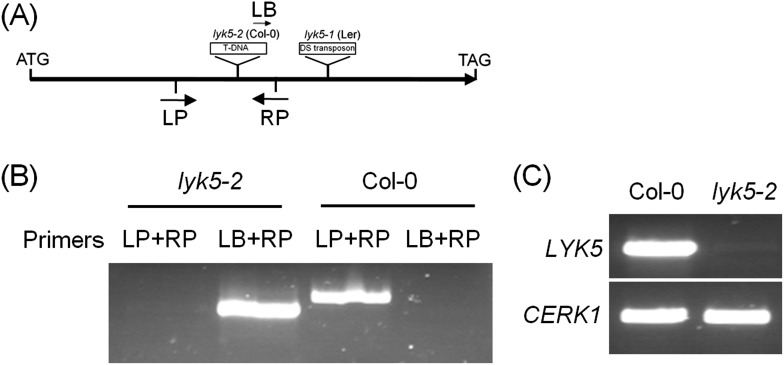
Figure 1—figure supplement 3. Characterization of Atlyk5 mutant plants.

Figure 1—figure supplement 3.

(A) Genomic structure of AtLYK5 and two insertion sites of two mutants. (B) Identification of T-DNA insertion by PCR using genomic DNA from Col-0 wild-type and Atlyk5-2 mutant plants. Location of primers used is shown in (A). Primer sequences are listed in Supplemental file 1. (C) RT-PCR was used to identify transcriptional expression of AtLYK5 in Col-0 WT and Atlyk5-2 mutant plants. Upper panel shows expression level of AtLYK5 in Col-0 and Atlyk5-2 mutant plants, lower panel shows expression of AtCERK1 as a control.
Figure 1—figure supplement 4. WRKY33 and WRKY53 gene expression in Atlyk5-2 mutant plants.

Figure 1—figure supplement 4.

(A) Calcium influx in the wild-type, Atcerk1 and Atlyk5-2 mutant plants expressing aequorin was recorded for 30 min after 100 nM flg22 treatment. (B) WRKY33 (At2g38470) and (C) WRKY53 (At4g23810) gene expression was analyzed using qRT-PCR in the wild-type, Atcerk1 and Atlyk5-2 mutant plants with or without treatment with chitooctaose, 8mer. UBQ10 (At4g05320) was used a control. Data are mean ± SE (n = 3). Asterisks indicate significant difference relative to chitiooctaose treated Col-0 wild-type plants (p < 0.01, Student's t test).
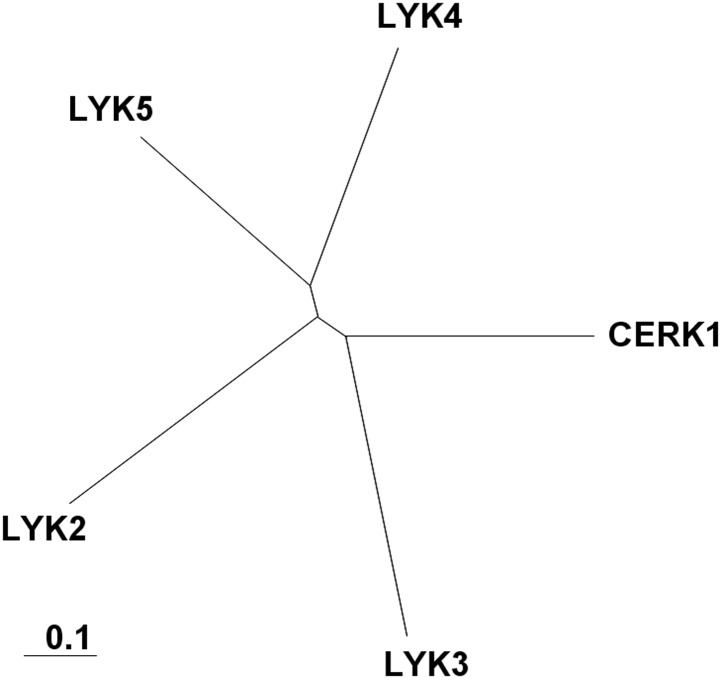
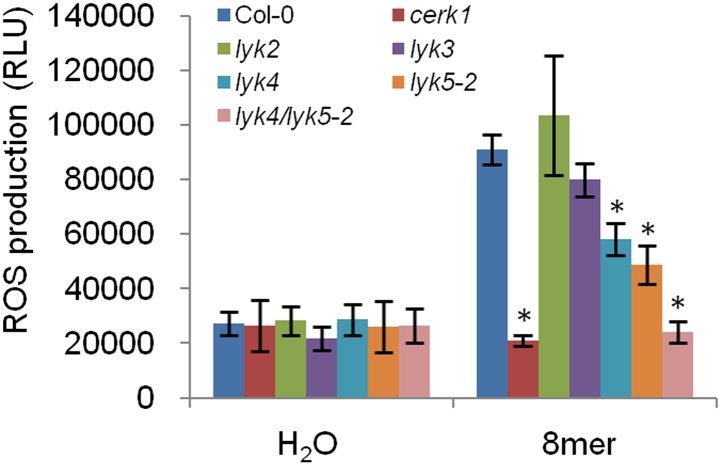
Figure 1—figure supplement 5. Chitin-induced ROS production in five lyk mutant plants.

Figure 1—figure supplement 5.

ROS production was measured from Col-0 wild-type, five Atlyk mutant, and Atlyk4/Atlyk5-2 double mutant plants for 30 min after treatment with 1 µM chitooctaose. Data are mean ± SE (n = 8). Asterisks indicate significant difference relative to chitooctaose treated Col-0 wild-type plants. (p < 0.01, Student's t test).