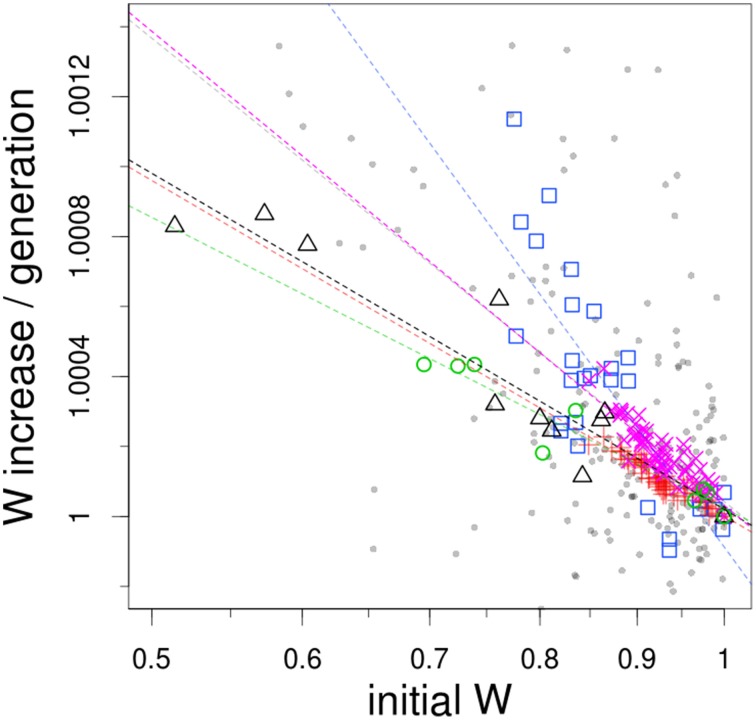
Figure 1.
Fitness increase as an inverse function of initial fitness. The datasets used here correspond to evolution experiments with S. cerevisiae (BY4741 strain, gray small circles; DBY15108 strain at 250 generations, magenta crosses; at 500 generations, red diagonal crosses), E. coli (mutator MG1655 strain, blue squares; wild-type REL606 strain, green circles) and microvirid bacteriophages (black triangles). Dashed lines shows best-fit log-log linear regression model to each dataset (correlation coefficients: gray, 0.33; magenta, 0.80; red, 0.87; blue, 0.67; green, 0.92; black, 0.87; F-test, all P < 10–15). Note that both axes are on a natural logarithmic scale.

