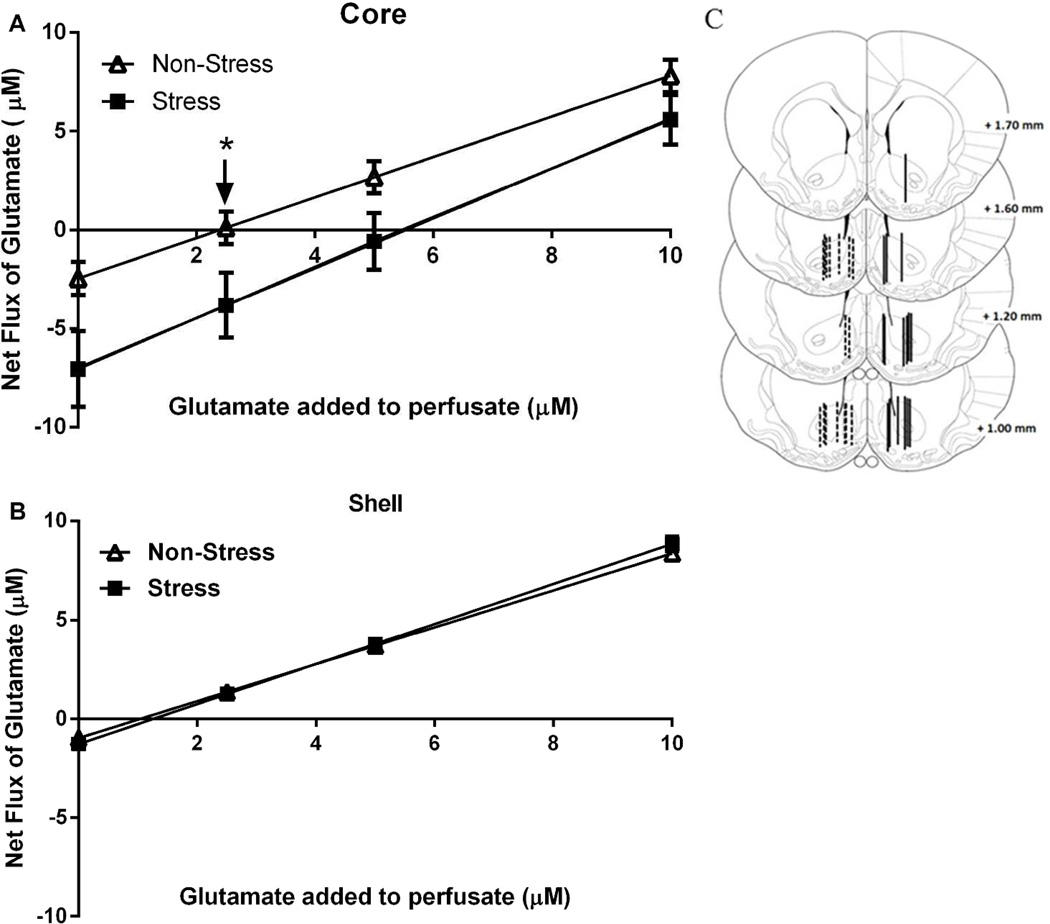
Figure 3. No-Net-Flux microdialysis in the Core and Shell reveals that acute stress augmented the basal levels of extracellular glutamate.
Plots from the no-net-flux in vivo microdialysis experiment. Net flux (y axis) is the difference between the glutamate concentration dialyzed into and recovered from the brain. The number of rats in each group (non-stress and stress) were 6–10 A Core: the x-intercept corresponding to the extracellular glutamate concentration were extrapolated from fitted regression lines and differed between treatment groups: non-stress: 2.09 ± 0.63 µM and stress 5.33 ± 1.24 µM. Data were analyzed by a t-test(16)=2.148, *p<0.05. The slopes of the regression line were not different between the two groups: non-stress: 1.03 ± 0.10 and stress: 1.26 ± 0.21. B Shell: neither the basal concentrations (non-stress: 1.04 ± 0.11 µM and stress: 1.23 ± 0.19 µM) nor the slope of the regression line (non-stress: 0.94 ± 0.04 and stress: 1.02 ± 0.03) differed between the two groups. C Illustration of the location of the active membrane of the dialysis probe in the Core and Shell according to Paxinos & Watson, 2007. The dashed and solid lines represent cannula placements in non-stress group and stress group, respectively.

