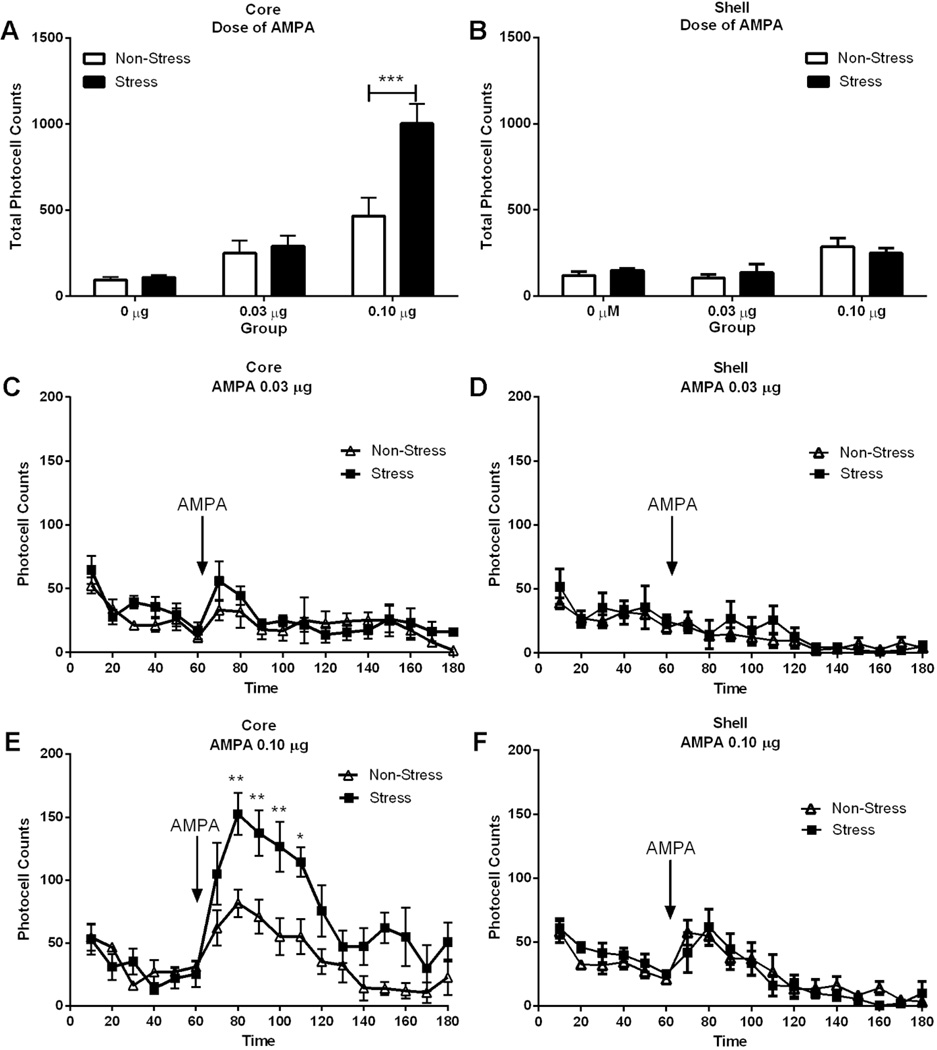
Figure 4. AMPA-induced locomotor activity is augmented in pre-stress rats.
The number of rats in each group (non-stress/vehicle, non-stress/AMPA, stress/vehicle, stress/AMPA) were 5–7. Data are represented as mean +/− SEM horizontal photocell counts. A-B Total horizontal photocell counts 120 min after the AMPA microinjection. Data were analyzed by a two-way ANOVA (non-stressed/stressed x dose) with repeated measure over dose. Core: interaction, F(2,39)=12,47; p<0.001; treatment F(1,39)=18,12, p<0.001; dose, F(2,39)=68.29, p<0.001; ***p<0.001, comparing pre-stress with control using a Bonferroni post-hoc. Shell: dose, F(2,32)=12,17; p<0.001. C-D Time-course of locomotor activity shown in the top panel corresponding to 0.03 µg AMPA in Core and Shell. There were no significant differences between treatments. Time-frame: 10 to 60 min acclimation before AMPA administration at 70 min. E-F Time-course of the locomotor activity shown in the top panel corresponding to 0.10 µg AMPA in Core and Shell. Data were analyzed by a two-way ANOVA (non-stressed/stressed x time) with repeated measures over time. Core: interaction, F(17,136)=2.74, p<0.001; treatment, F(1,136)=14.20, p<0.01; time, F(17,136)=12.42, p<0.001; *p<0.05, **p<0.001, comparing pre-stress with control using a Bonferroni post-hoc. Shell: the data analyzed did not reveal significant differences between both stress and non-stress groups.

