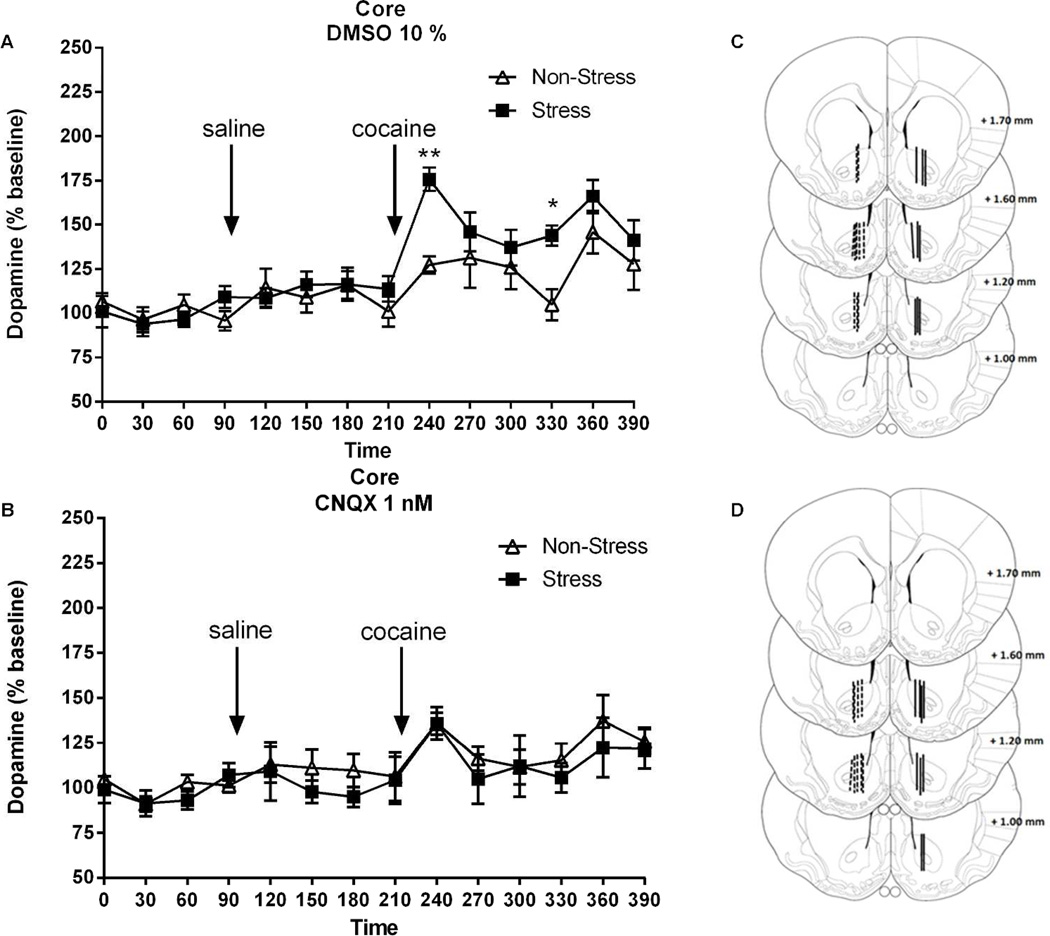
Figure 7. Blockade of AMPA receptors in the core prevents the augmented rise in extracellular dopamine elicited by cocaine.
The number of rats in each group (non-stress/vehicle, non-stress/CNQX, stress/vehicle, stress/CNQX) were 7–8. Data were normalized to percent change from baseline. A Core: time-frame 0 to 90 min corresponds to the acclimation period before DMSO plus saline administration at 120 min. The arrow pointing at 240 min denotes the time of DMSO plus cocaine (15 mg/kg) administration. Data were analyzed by two-way ANOVA (non-stressed/stressed x time) with repeated measures over time. Interaction, F(13,195)=1.85, p<0.05; treatment, F(1,195)=4.99, p<0.05; time, F(13,195)=10.28, p<0.001; *p<0.05, **p<0.01, comparing pre-stress with control using a Bonferroni post-hocB Core: time-frame 0 to 90 min corresponds to the adaptation before the CNQX plus saline administration at 120 min. The 240 min correspond to the CNQX (1 nM) plus cocaine (15 mg/kg) administration. Data were analyzed by two-way ANOVA (non-stressed/stressed x time) with repeated measures over time. Time, F(13,221)=3.76, p<0.0001. C-D Summary example of the location of the active membrane of the dialysis probe in the core for dopamine according to Paxinos & Watson, 2007 after DMSO or CNQX respectively. The dashed lines represent cannula placements in non-stress group and solid lines depict placements in stress group.

