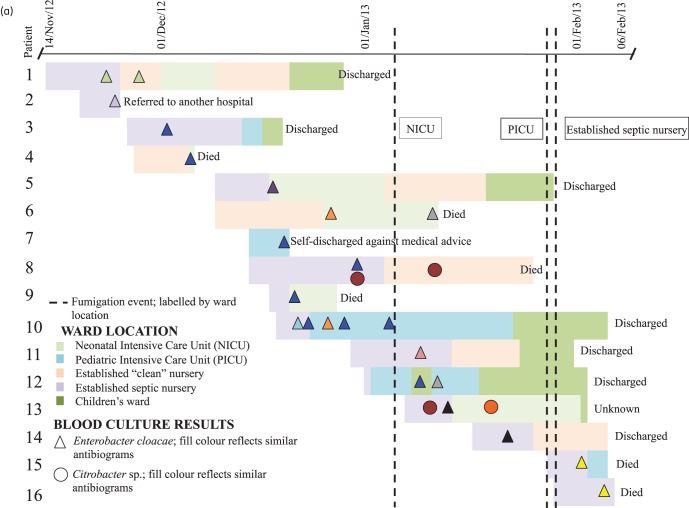
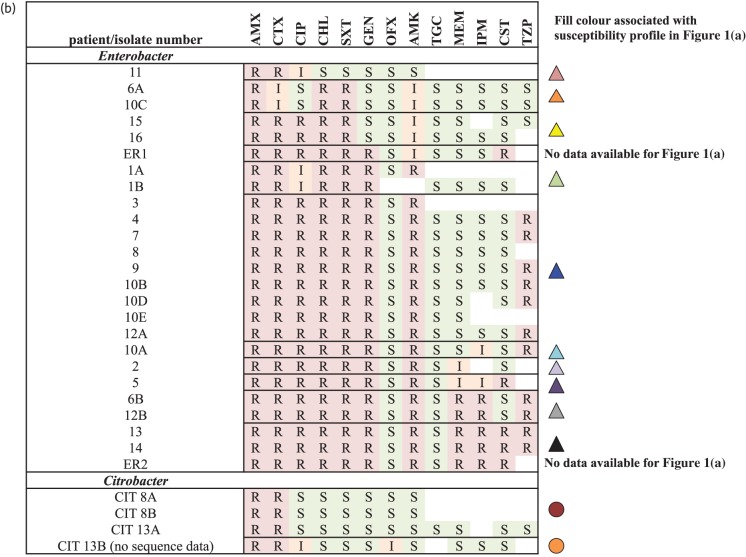
Figure 1.
Timeline of the outbreak, with each set of horizontal bars representing a patient admission, coloured by ward location, and annotated with culture result and outcome. (b) Disc diffusion-based phenotypic susceptibility profiles from the hospital laboratory for isolates represented in (a). Fill colours of the isolates in (a) reflect clustering on the basis of disc diffusion-based phenotypic profiles in (b). Clustering is based on the most likely susceptibility profile given incomplete data. Epidemiological data for ‘ER1’ and ‘ER2’ were not available. Broken lines represent the occurrence of fumigation events in single units. AMX, amoxicillin; CTX, cefotaxime; CIP, ciprofloxacin; CHL, chloramphenicol; SXT, trimethoprim/sulfamethoxazole; GEN, gentamicin; OFX, ofloxacin; AMK, amikacin; TGC, tigecycline; MEM, meropenem; IPM, imipenem; CST, colistin; TZP, piperacillin/tazobactam.


