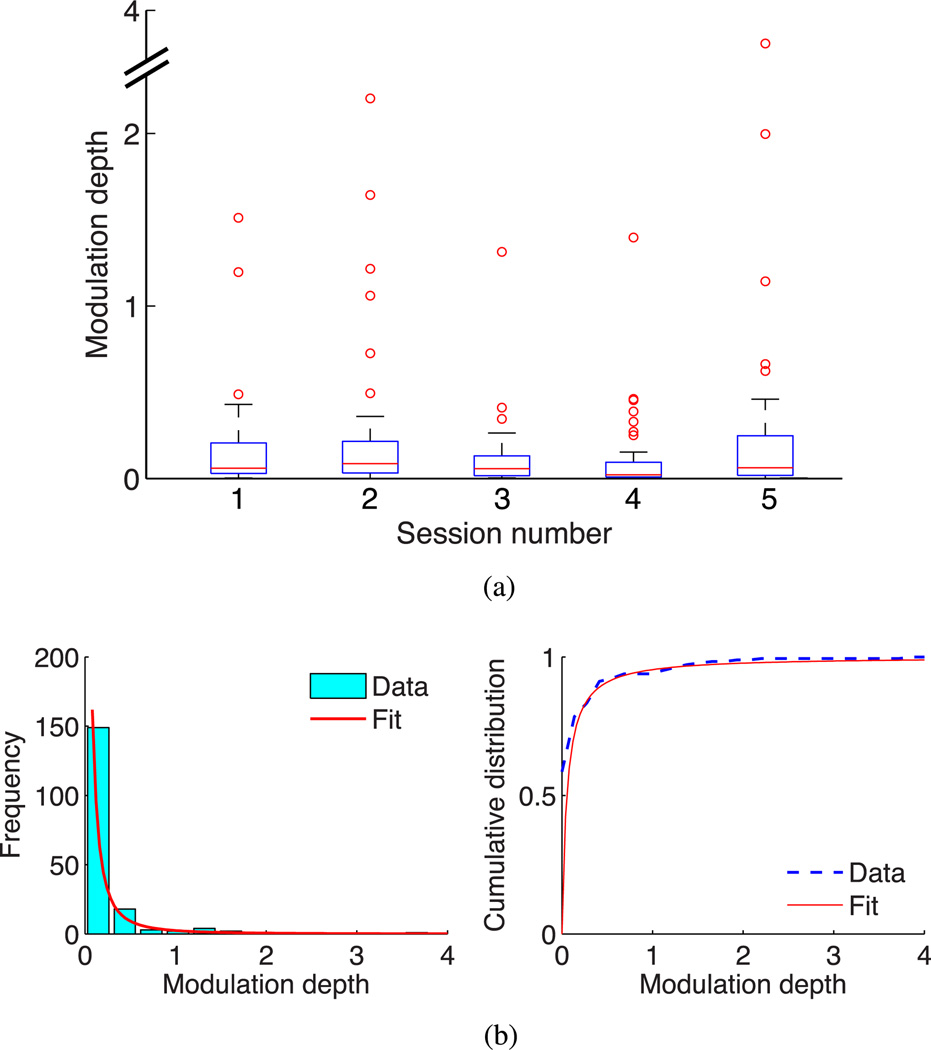
Fig. 6.
Statistical characterization of single-unit MD. (a) Distribution of MD of various channels in each of five research sessions. Red line: median; box: interquartile range [q1, q3]; whiskers: extreme points that are not outliers and lie within the range q3 ± 1.5 (q3 − q1); red circles: outliers. (b) (Left) Histogram of MD data from five research sessions, along with the scaled best-fit generalized Pareto probability density function. (Right) Cumulative distribution function of MD data and best-fit generalized Pareto distribution.

