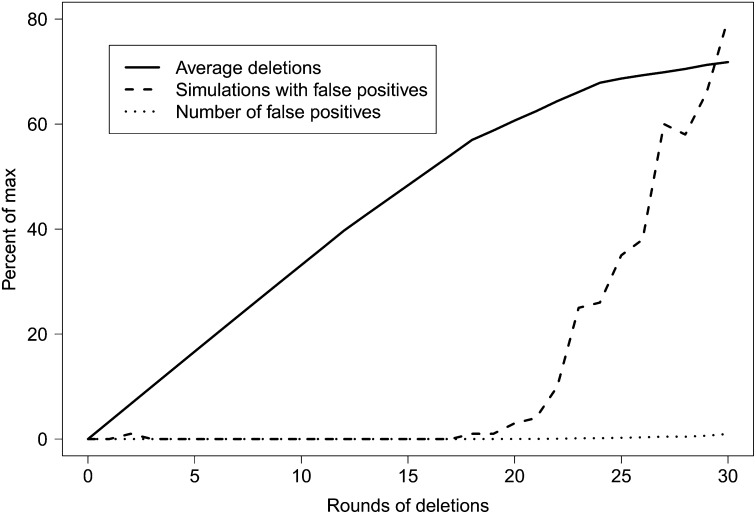
Fig. 2.
Results of null allele trials. One hundred data sets were simulated at each number of rounds of deletions. Lines show average deletions, simulations with false positives, and the total number of false positives for all simulations with a given number of rounds of deletions. Results are shown as a percentage of the maximum possible value of each variable.

