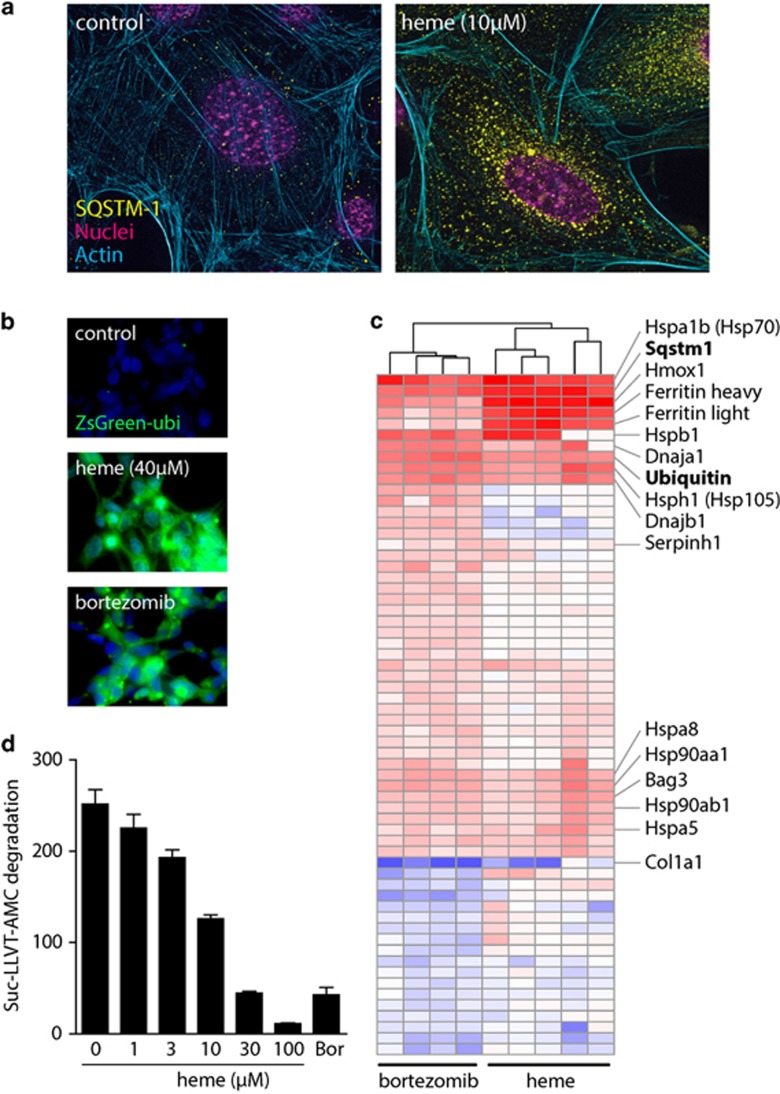
Figure 4.
Heme is an inhibitor of the proteasome. (a) Immunofluorescence of Sqstm1/p62 (yellow) and actin (cyan) in Hmox1 (+/+) and Hmox1 (−/−) MEFs after exposure to heme (5 μM) for 5 h. Magenta indicates nuclei. Images were acquired with a Zeiss Observer Z1 equipped with an ApoTome.2 module and an Axiocam MRm at × 400 original magnification. (b) Effect of heme (40 μM) and bortezomib (100 pM) treatment for 6 h on the accumulation of an ubiquitin-tagged fluorescent protein (ZsGreen) expressed in HEK-293 cells. (c) Hierarchical clustering analysis of all proteins that have been identified as differentially expressed in heme-treated Hmox1 (−/−) cells and bortezomib-treated (10 pM) Hmox1 (+/+) MEF cells, respectively. The heme response data include all data from heme-treated Hmox1 (−/−) MEF cells shown in Figure 2 that were included into this analysis as the five condition group means. The bortezomib data represent data from four independent SILAC experiments. The plot includes all proteins with an absolute expression ratio of >0.5 (log2) in treated compared with matched untreated control cells (P<0.05). Red indicates protein expression higher in treated cells, and blue indicates protein expression lower in treated cells. The identical plot with labeling of all proteins can be found in Supplementary Figure 2. (d) Enzymatic activity of purified 26S proteasome±increasing concentrations of heme, as assessed by monitoring the release of fluorescent AMP from the proteasome substrate peptide Suc-LLVT-Amc. Bortezomib (Bor, 100 pM) was used as a positive proteasome inhibitor control. Data were corrected for fluorescence quenching by heme, and represent mean±S.D. of six independent replicates

