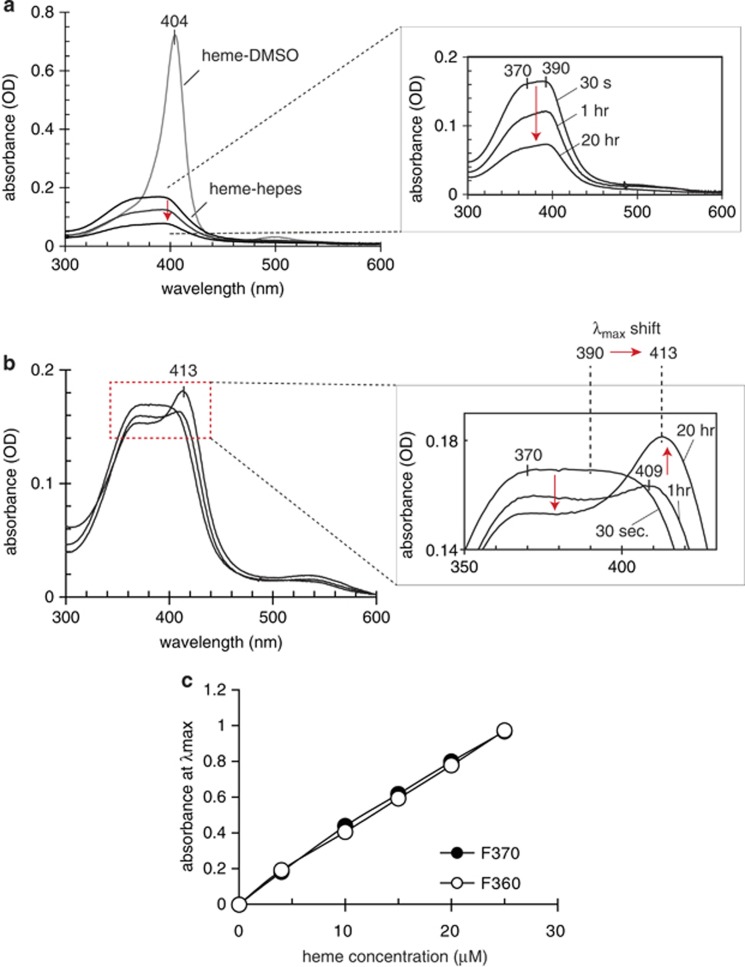
Figure 5.
Heme binding to proteasome: UV/Vis spectrophotometry. (a) UV/Vis spectra of heme in DMSO or diluted in Hepes buffer (pH 7.4). The inset shows the time-dependent absorbance decay (red arrow) of heme in HEPES buffer. The spectra of heme in DMSO remained stable over days. (b) Time-dependent changes in the UV/Vis spectra of the heme in HEPES buffer sample shown in (a) after addition of proteasome-enriched cytoplasmic protein fraction. The inset shows enlarged selected spectra that reflect the major changes over time. The protein concentration in the proteasome fraction was 1.4 mg/ml. Identical results were observed with two proteasome fractions from rabbit reticulocyte (F360) and from HeLa cells (F370), respectively. (c) Changes in maximum absorbance after heme binding to the two proteasome fractions F360 and F370 across a range of heme concentrations

