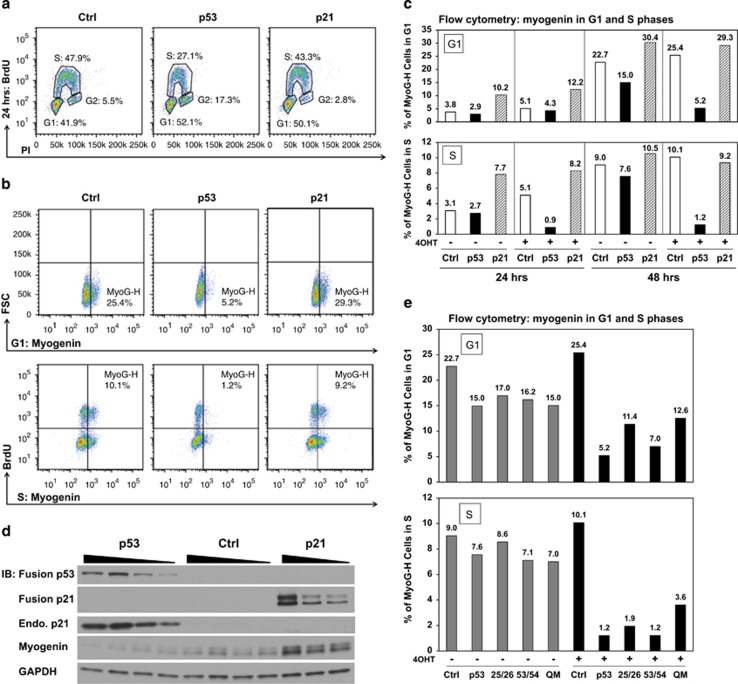
Figure 2.
The reduction of myogenin protein in response to p53 activation is independent of cell cycle phases. (a) Distribution of cell cycle phases was quantified in RD cells ectopically expressing control, p53, or p21. The flow cytometry plot shows G1, S, and G2 phases based on BrdU and PI staining. (b) Reduction of myogenin protein in each cell cycle phase was evaluated by co-immunostaining of myogenin and BrdU, followed by flow cytometry analysis. Quadrants were drawn to denote a MyoG-H population in either G1 or S phase at 48 h of 4OHT induction. Ectopic expression of p21 served as a positive control. FSC: forward scatter. (c) Summary of the percentage of cells with MyoG-H expression in either G1 or S phase in response to ectopic p53 or p21 expression. (d) Immunoblotting (IB) shows that p53 activation induced expression of endogenous p21 and repressed myogenin expression in contrast to ectopic expression of p21, which led to accumulation of myogenin at 24 h of 4OHT induction. (e) Expression of myogenin protein in response to ectopic p53 and its mutants is summarized as the percentage of MyoG-H cells in either G1 or S phase at 48 h of 4OHT induction

