Figure 2.
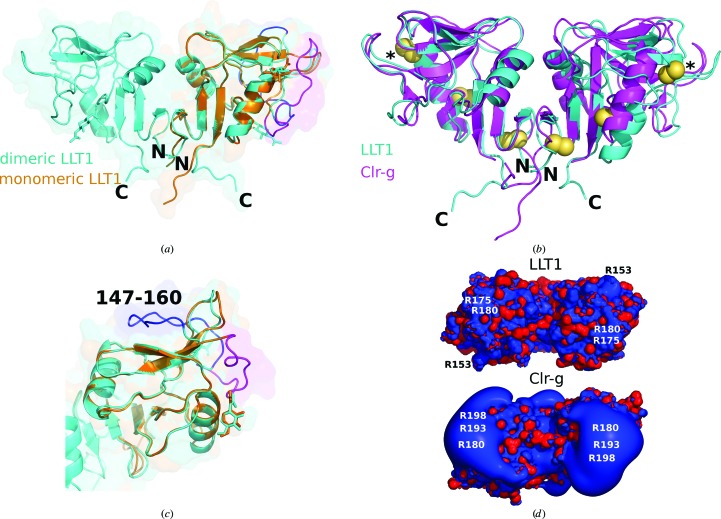
(a) Structures of the dimeric (LLT1_D2, cyan) and monomeric (LLT1_mono, orange) forms of LLT1. The loop is in its standard dimeric position in LLT1_D2 (blue) and is in the swapped position in LLT1_mono (magenta). The N- and C-termini of LLT1_D2 are denoted. (b) Comparison of the structure of LLT1_D2 (cyan) with its mouse orthologue Clr-g (PDB entry 3rs1, magenta). The superposition was performed in Coot by SSM of chains A (on the left). The N- and C-termini of LLT1_D2 are denoted. Disulfide bonds are shown as yellow spheres, with the artificial disulfide bonds induced by the H176C mutation denoted by asterisks. (c) A detailed view of the loop position discussed in (a). (d) Electrostatic equipotential surfaces of LLT1_D2 (top) and mouse Clr-g (bottom). They are displayed at the 3 kT/e (blue) and −3kT/e (red) levels as computed in APBS (Baker et al., 2001 ▶). The view is from the ‘top’ of the dimer, i.e. from the termini-distal side.

