
Figure 10.
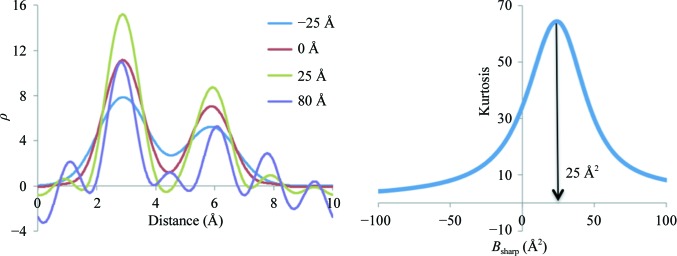
Left, distribution of Fourier map values of resolution 1.5 Å along the Mg—O bond corresponding to different sharpening B factors (B sharp). Right, map kurtosis as function of B sharp.
Official websites use .gov
A
.gov website belongs to an official
government organization in the United States.
Secure .gov websites use HTTPS
A lock (
) or https:// means you've safely
connected to the .gov website. Share sensitive
information only on official, secure websites.
Left, distribution of Fourier map values of resolution 1.5 Å along the Mg—O bond corresponding to different sharpening B factors (B sharp). Right, map kurtosis as function of B sharp.