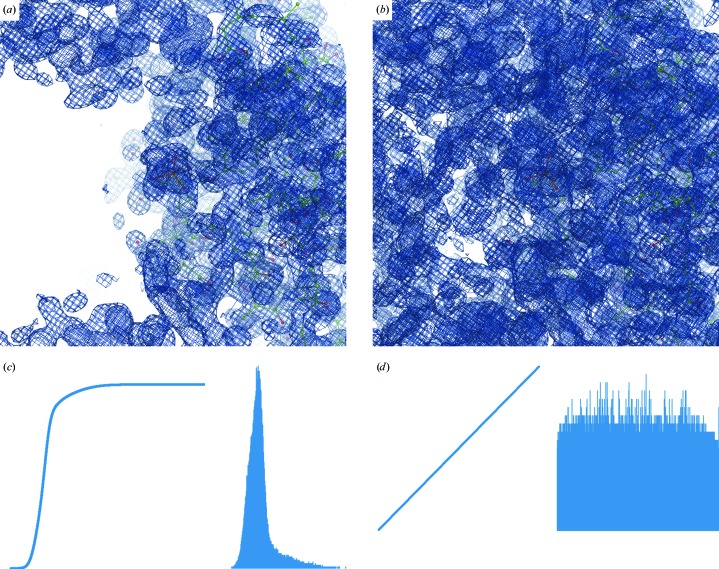
Figure 14.
Illustration of histogram equalization for PDB entry 2bwl. First row, original map from (1) contoured at 1.3σ (left) and the HE map (right) at the same contour level. Second row, histogram and cumulative histogram of the synthesis values: left, original map; right, HE map.

