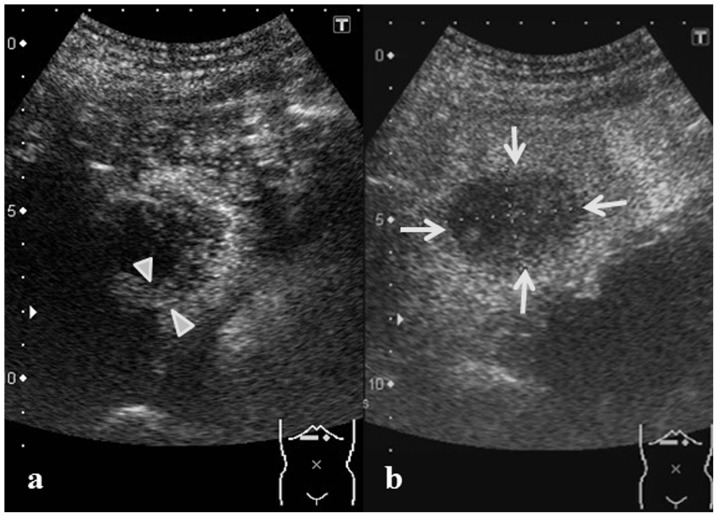
Figure 3.
Abdominal contrast-enhanced ultrasonography at the time of admission. (a) A contrast enhancement effect of ~5 mm was indicated at the tumor border in the vascular phase in the tumor in the S2 liver segment (arrowheads). (b) A defect in the entire tumor was observed in the post-vascular phase (arrows).

