Figure 1.
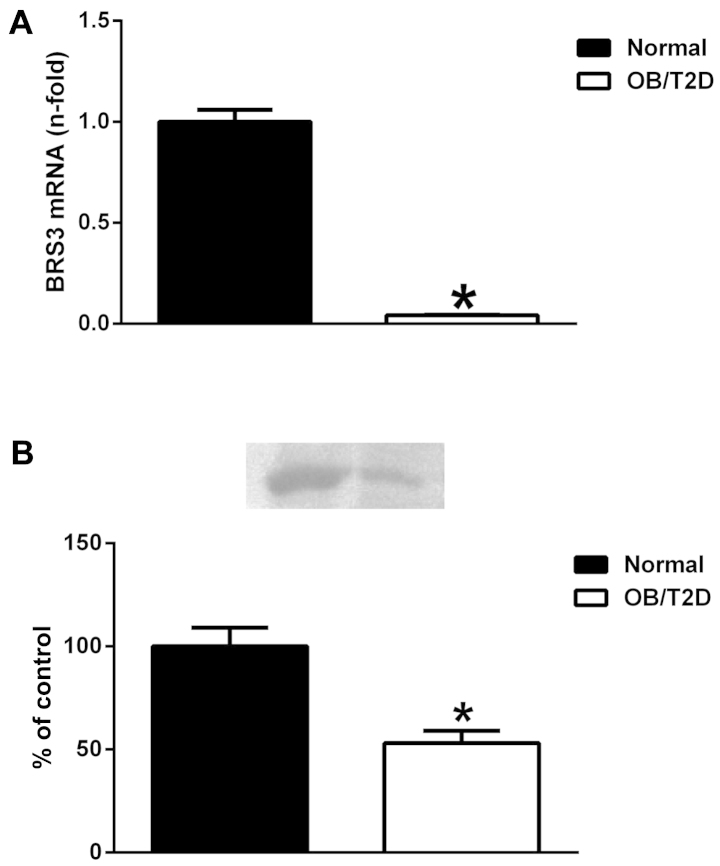
Bombesin receptor subtype-3 (BRS-3) gene expression and protein levels in muscle tissue sections from patients with obesity and type 2 diabetes (OB/T2D) and normal subjects. (A) BRS-3 gene expression level in skeletal muscle tissue sections. Values (means ± SEM) are expressed as copy of numbers by using the Ct value relative to that of the normal subjects after normalization against 18S rRNA (2−ΔΔCt). Patients with OB/T2D, n=5 and normal subjects, n=19. *p<0.001, OB/T2D vs. normal subjects. (B) BRS-3 protein expression level in skeletal muscle tissue sections. Values (means ± SEM), corresponding to total protein extracted are expressed as a percentage of measurements relative to the normal subjects. Patients with OB/T2D, n=5 and normal subjects, n=4; upper panel corresponds to a representative immunoblot, and lower panel represents quantitative analysis of the BRS-3 protein level. *p<0.001 OB/T2D vs. normal subjects.

