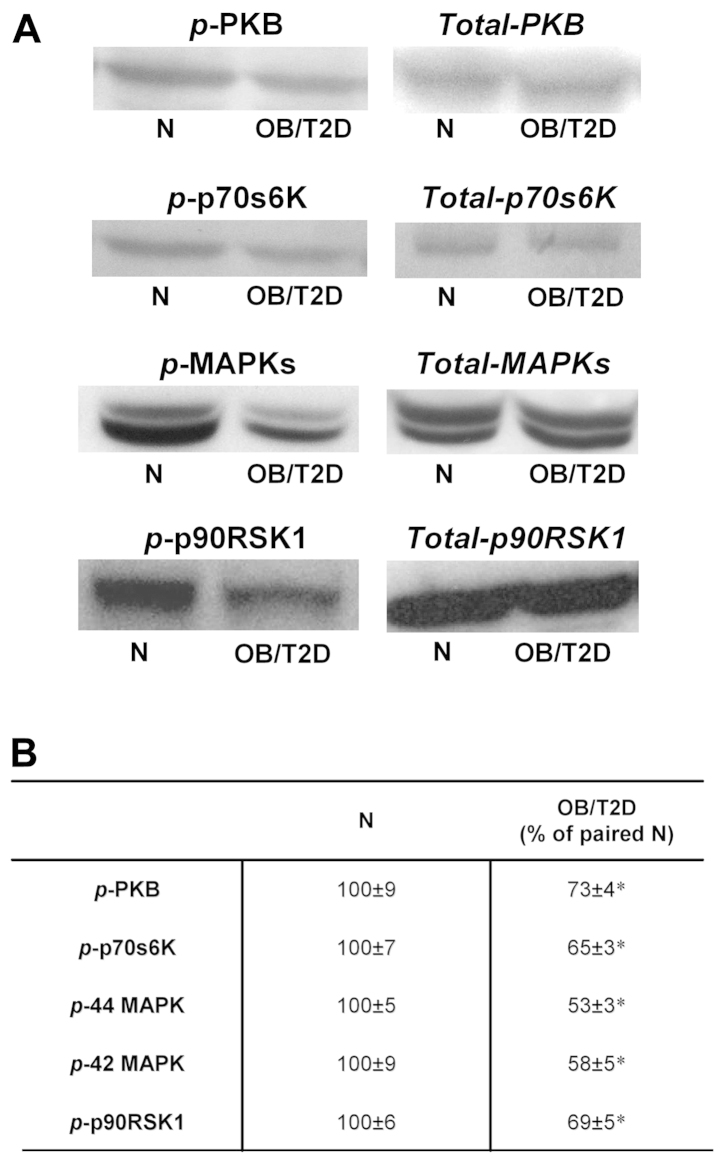
Figure 2.
PKB, p70s6K, p42/p44 MAPKs and p90RSK1 phosphorylated forms, in cultured primary myocytes from patients with obesity and and type 2 diabetes (OB/T2D) compared to normal subjects (N). Results (means ± SEM) are expressed relative to the control value obtained from cells from normal subjects. Patients with OB/T2D, n=5 and normal sujbects, n=2; (A) representative immunoblots, and (B) quantitative analysis. *p<0.001 OB/T2D vs. normal sujbects.

