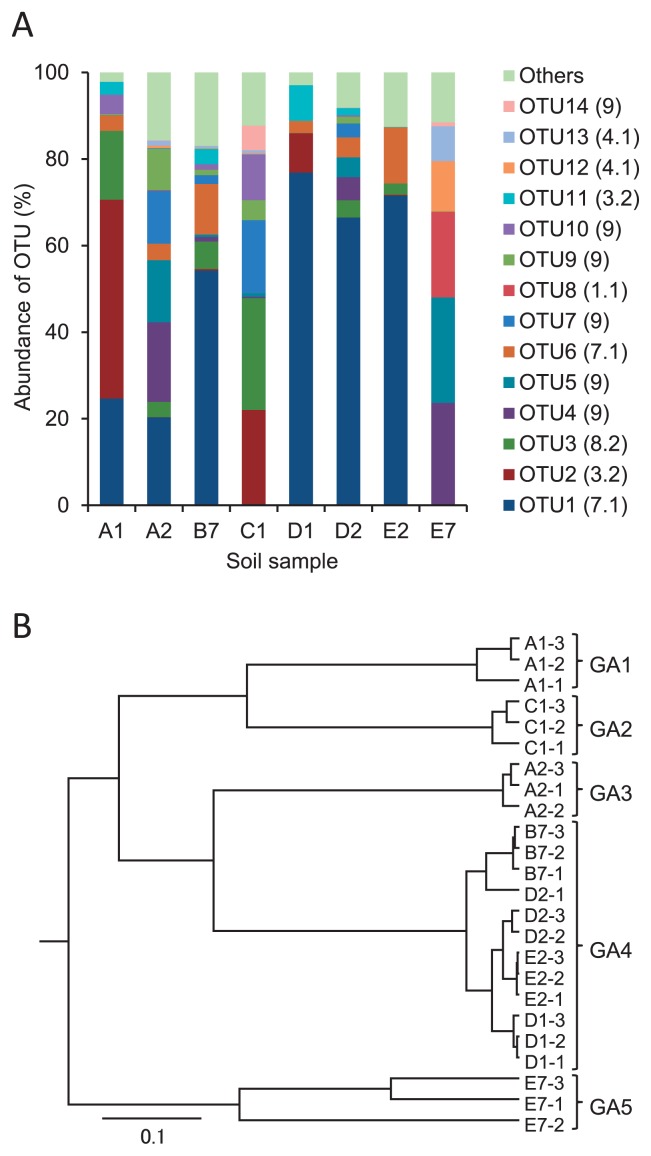
Fig. 3.
Relative abundance of AOA amoA OTUs (A), and the UPGMA cluster tree (B). The relative abundances in panel A show the average of three replicates. The OTU numbers are followed by the Nitrosophaera subcluster numbers, which are given in parentheses. The cluster tree in panel B was constructed using the average of three replicates.

