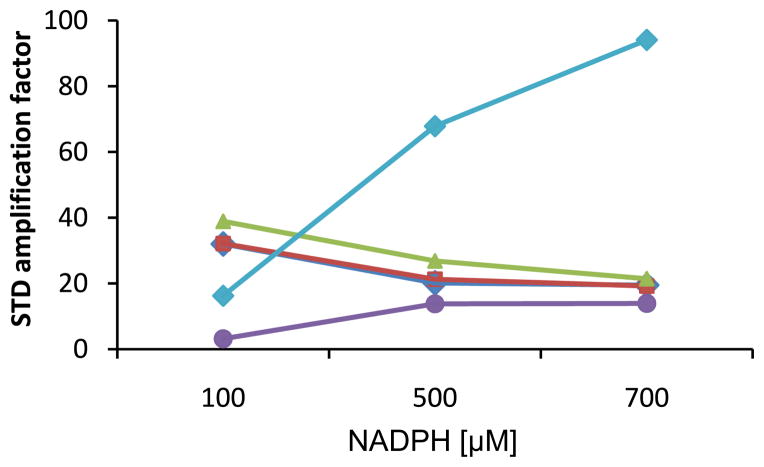
Figure 2.
Variation of STD amplification factors with NADPH concentration in NADPH and PZA
competition experiments. NADPH resonances H3  and H5
  have very different STD amplification factors,
suggesting that they do not interact equally with the protein whereas H3
 , H5
, H5  and H6
  of PZA show very comparable declines in
amplification.

