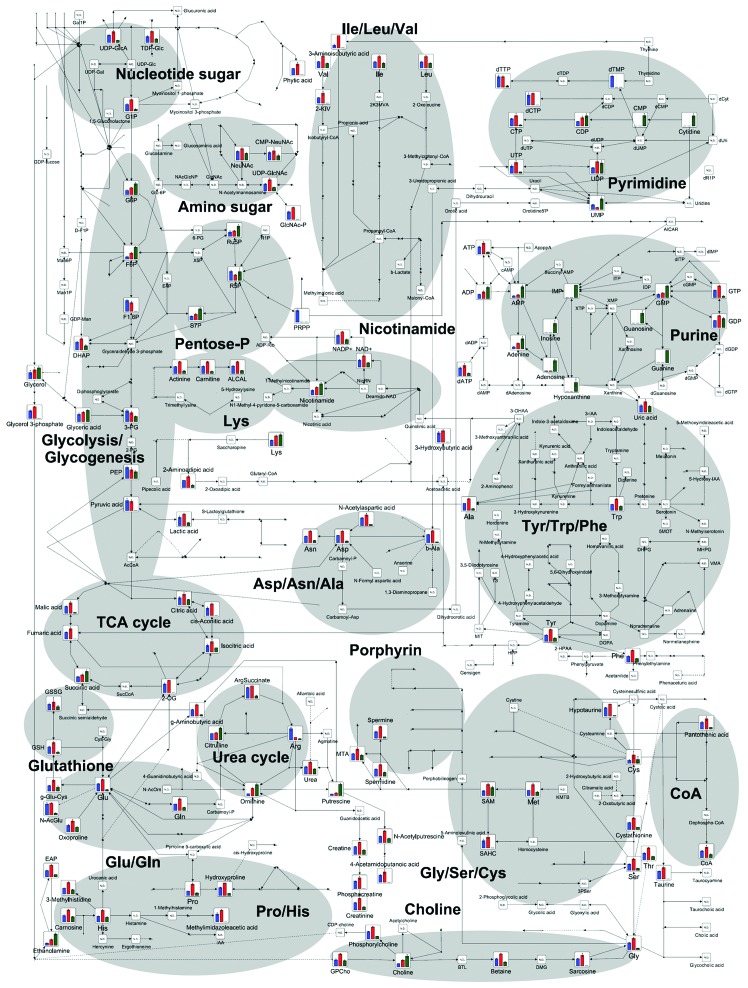
Figure 2.
Metabolome data map of all metabolic pathways in HCT116 cells. Each bar represents the relative amount of a metabolite for non-treatment (blue) and treatment with FF/CAP18 at 10 μg/ml (red) or 40 μg/ml (green). All metabolite data are shown as the mean of triplicate samples ± standard deviation.

