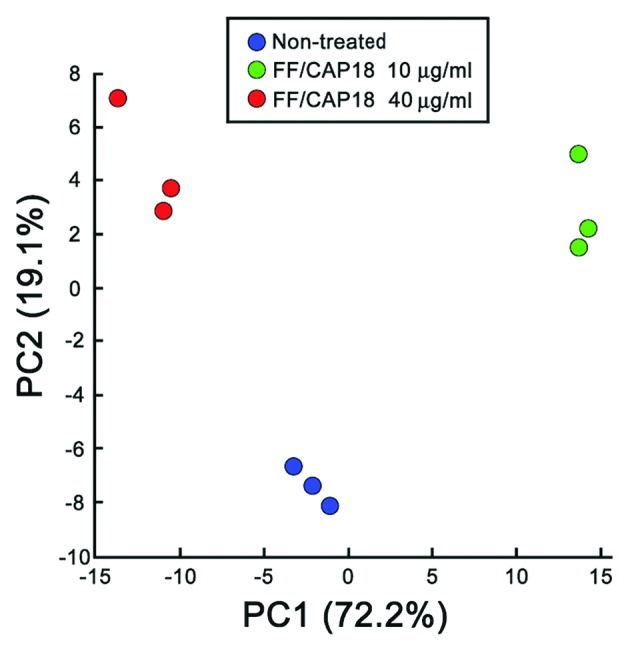
Figure 5.

Principal component analysis (PCA) plot of metabolome analysis data that characterizes the trends exhibited by the expression profiles of non-treated HCT116 cells (blue), HCT116 cells treated with FF/CAP18 at 10 μg/ml (red) and HCT116 cells treated with FF/CAP18 at 40 μg/ml (green). The x-axis shows the distance of PC1 and the y-axis shows the distance of PC2 in the scatter plot. PCA was carried out using the proprietary software, SampleStat.
