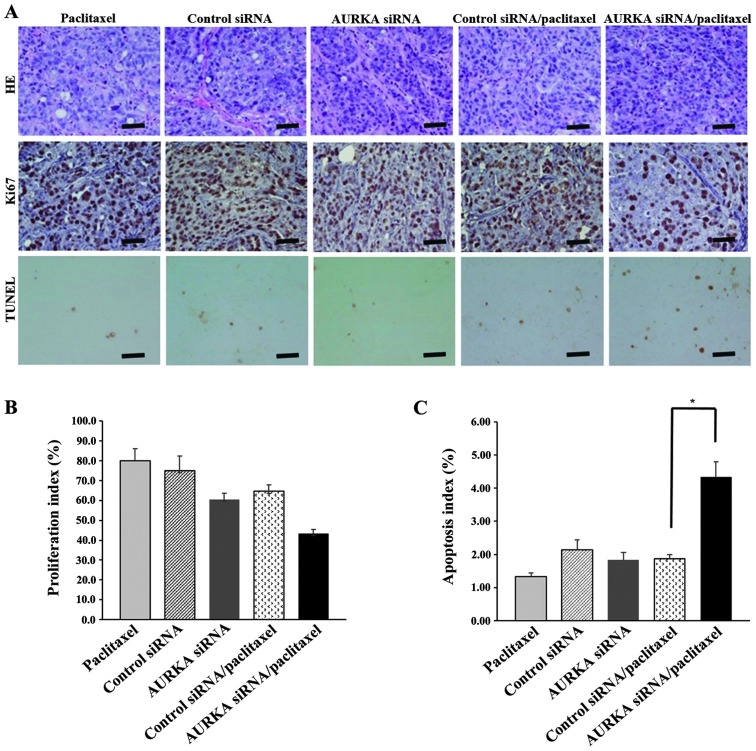
Figure 6.
Pathological findings. (A) H&E staining and TUNEL and Ki67 staining of HEC-1B tumor sections after indicated treatment. (B) Ki67 proliferative index. (C) Apoptosis index. Scale bars, 50 μm. Ki67 and TUNEL staining, positive cells were counted and the percentage of positive cells out of the total number of cancer cells was calculated. Data are expressed as means ± SE. *P<0.05, n=5.

