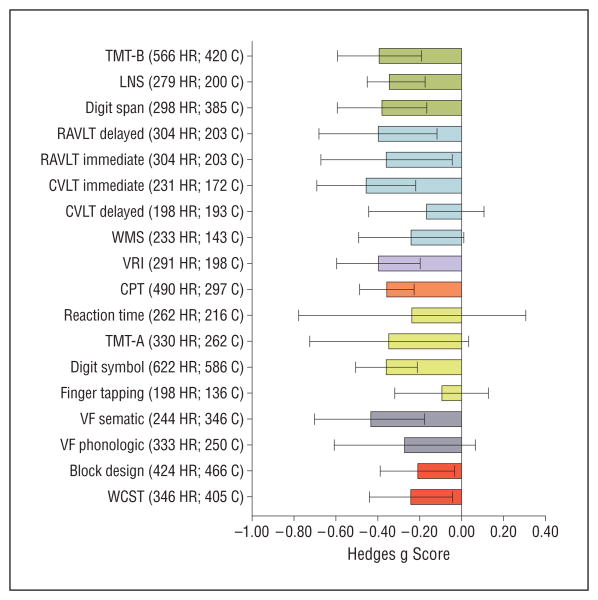
Figure 5.
Neurocognitive profiles of individual tasks in high-risk individuals (n = 1188) compared with controls (n = 1029).92 Mean Hedges g scores are shown across cognitive tasks (negative values indicate worse performance in high-risk individuals compared with the control group). Error bars represent 95% CI. C indicates number of controls; CPT, Continuous Performance Test (d prime); CVLT, California Verbal Learning Test; HR, number of high-risk individuals; LNS, Letter Number Sequencing; RAVLT, Rey Auditory Verbal Learning Test; TMT-A, Trail Making Test Part A; TMT-B, Trail Making Test Part B; VF, Verbal Fluency; VRI, Visual Reproduction Index (WMS visual reproduction and Rey complex figures); WCST, Wisconsin Card Sorting Test (perseverative errors); and WMS, Wechsler Memory Scale (verbal recall). Working memory is shown in green, verbal memory in blue, visual memory in violet, attention in orange, processing speed in yellow, verbal fluency in gray, and executive functions in red.

