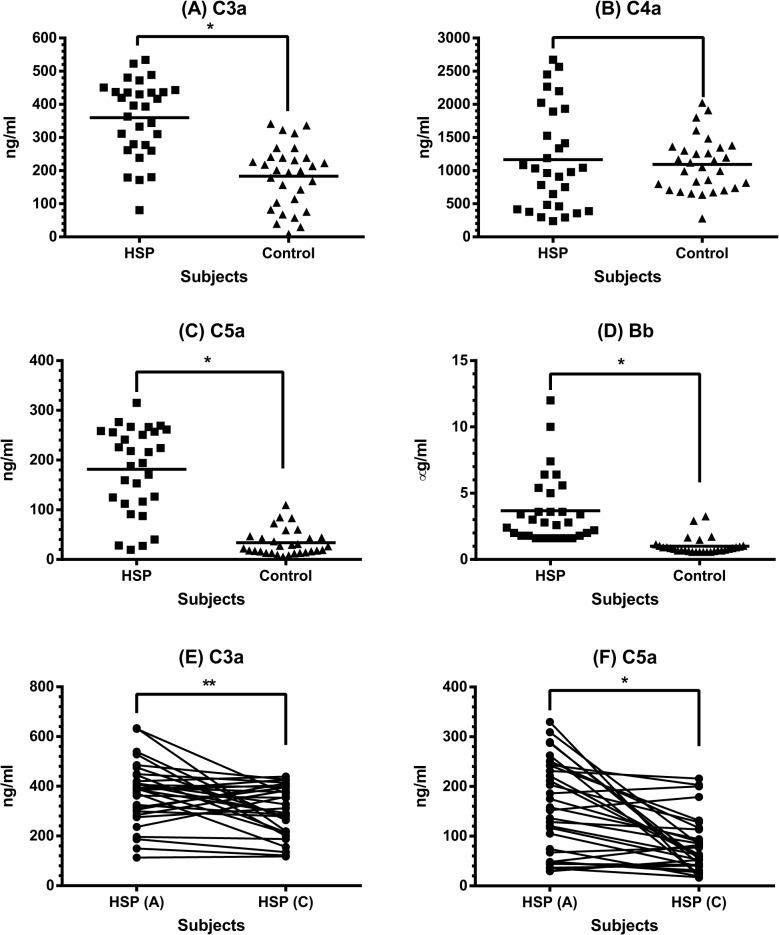
Fig 2. The plasma levels of complement proteins in HSP patients.
Plasma C3a (A), C4a (B), C5a (C), and Bb (D) levels were determined by ELISA between 30 patients with acute HSP and 30 healthy controls. * denotes p < 0.0001. Plasma C3a (E) and C5a (F) levels in HSP patients between acute and convalescent stages were compared. * denotes p < 0.0001, ** denotes p = 0.007.

