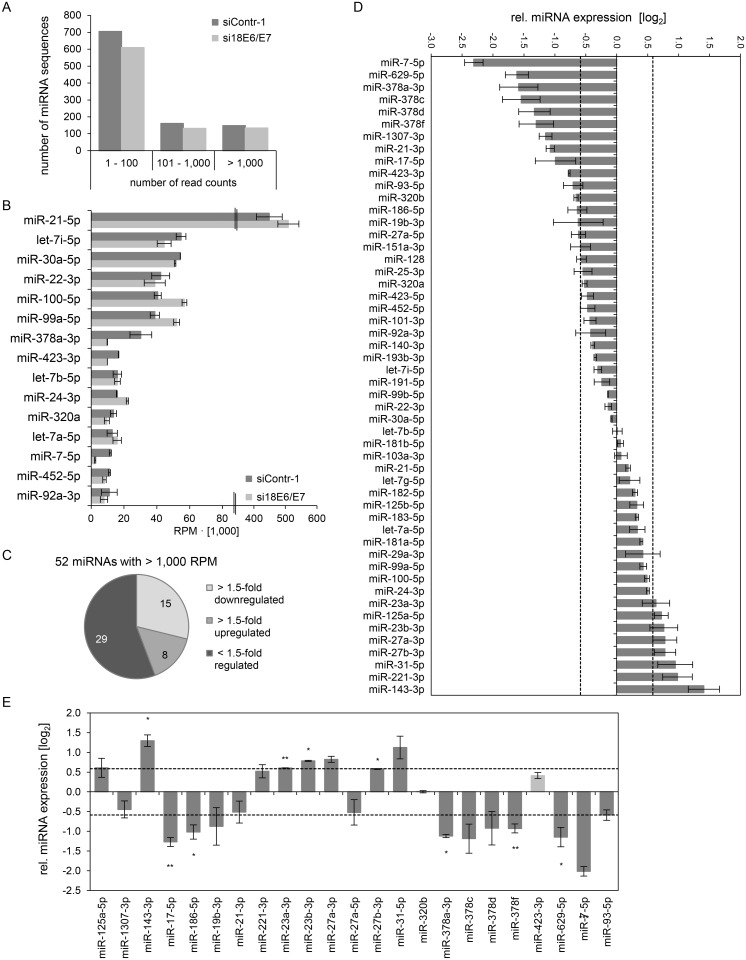
Fig 2. Inhibition of endogenous HPV18 E6/E7 expression: Effects on the intracellular miRNA composition of cervical cancer cells.
Small RNA deep sequencing (A—D) and qRT-PCR analyses (E) of cellular miRNAs, 72 h after transfection of HeLa cells with si18E6/E7 or control siRNA siContr-1. (A) Mean read count distribution of mature miRNA sequences in si18E6/E7- and siContr-1-transfected cells (n = 2). Only miRNAs with a mean read count > 1 were considered. (B) The 15 most frequently sequenced cellular miRNAs. Selection based on siContr-1 samples, respective values for the si18E6/E7-treatment are indicated. Data represent mean ± SEM (n = 2). Interrupted x-Axis. (C) Overview on differentially affected (> 1.5-fold) cellular miRNAs, determined by small RNA deep sequencing. RPM values of si18E6/E7-treated samples were calculated relative to the control treatment (siContr-1). Only miRNAs with > 1,000 RPM in each sample were considered (n = 2). (D) Relative quantification of miRNAs in si18E6/E7- versus siContr-1-treated cells as assessed by small RNA deep sequencing (log2 display). Dashed lines: 1.5-fold up- or downregulation (log2(1.5) = 0.585). Only miRNAs with > 1,000 RPM in each sample were considered. Data represent mean ± SEM (n = 2). (E) qRT-PCR analyses of E6/E7-dependent cellular miRNAs identified by small RNA deep sequencing. Cellular miRNA levels were normalized to snRNA RNU6–2 and calculated relative to siContr-1 (log2 display). Dashed lines: 1.5-fold up- or downregulation (log2(1.5) = 0.585). The column color shows regulation in the same (dark grey) or opposite (light grey) direction compared to the small RNA deep sequencing data of the individual miRNAs. Data represent mean ± SEM (n = 2 or 3). Asterisks indicate statistically significant differences (p ≤ 0.05 (*), p ≤ 0.01 (**) and p ≤ 0.001 (***)).

