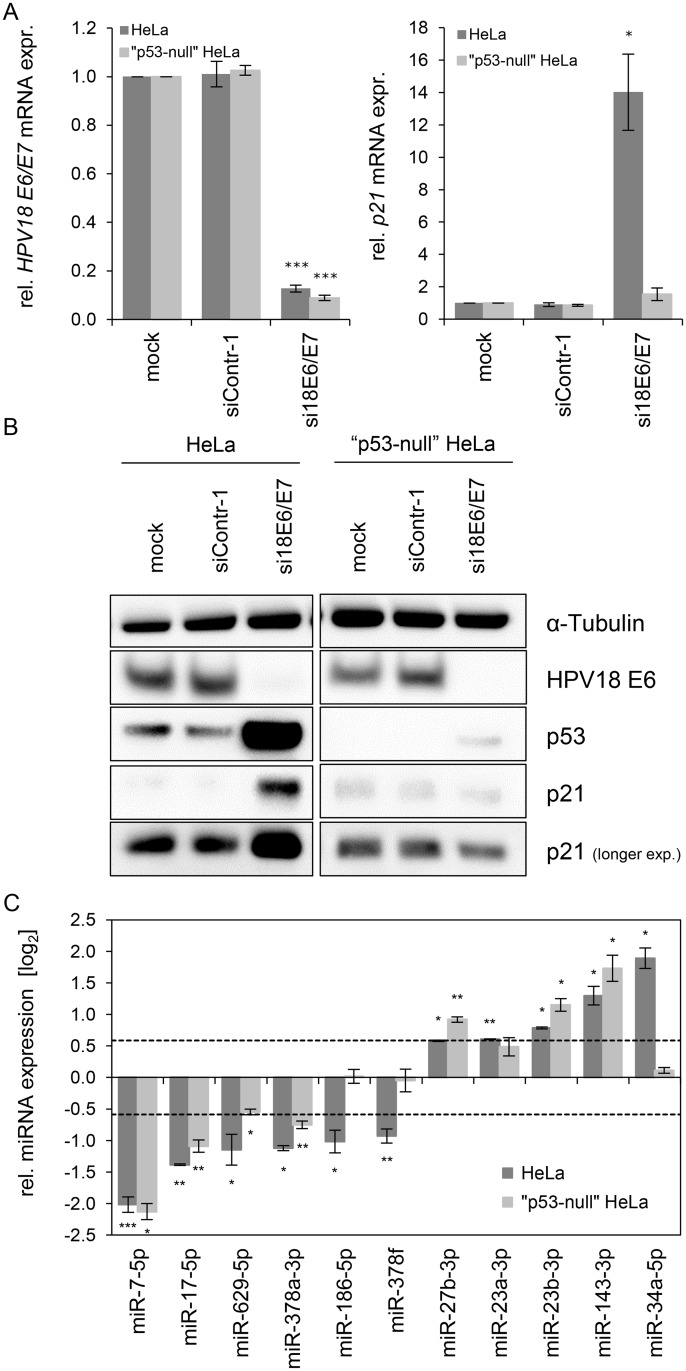
Fig 4. Effects of the p53 status on the E6/E7-dependent modulation of intracellular miRNAs.
(A) qRT-PCR analysis of HPV18 E6/E7 (left panel) and p21 (right panel) mRNA expression, 72 h after transfection of parental or “p53-null” HeLa cells with si18E6/E7, control siRNA (siContr-1), or upon mock treatment. mRNA levels were normalized to ACTB and calculated relative to the mock control (mock). Data represent mean ± SEM (n = 3). Asterisks above columns indicate statistically significant differences from siContr-1-treated cells (p ≤ 0.05 (*), p ≤ 0.001 (***)). (B) Immunoblot analysis of HPV18 E6, p53 and p21 protein levels, 72 h after transfection of parental or “p53-null” HeLa cells with si18E6/E7 or siContr-1, or upon mock treatment. α-Tubulin: loading control. (C) qRT-PCR analyses of selected cellular miRNAs, 72 h after transfection of parental or “p53-null” HeLa cells with si18E6/E7 or siContr-1. miR-34a-3p, positive control miRNA (p53-inducible). Cellular miRNA levels were normalized to snRNA RNU6–2 and calculated relative to siContr-1 (log2 display). Dashed lines: 1.5-fold up- or downregulation (log2(1.5) = 0.585). Data represent mean ± SEM (n = 3). Asterisks indicate statistically significant differences (p ≤ 0.05 (*), p ≤ 0.01 (**) and p ≤ 0.001 (***)).

