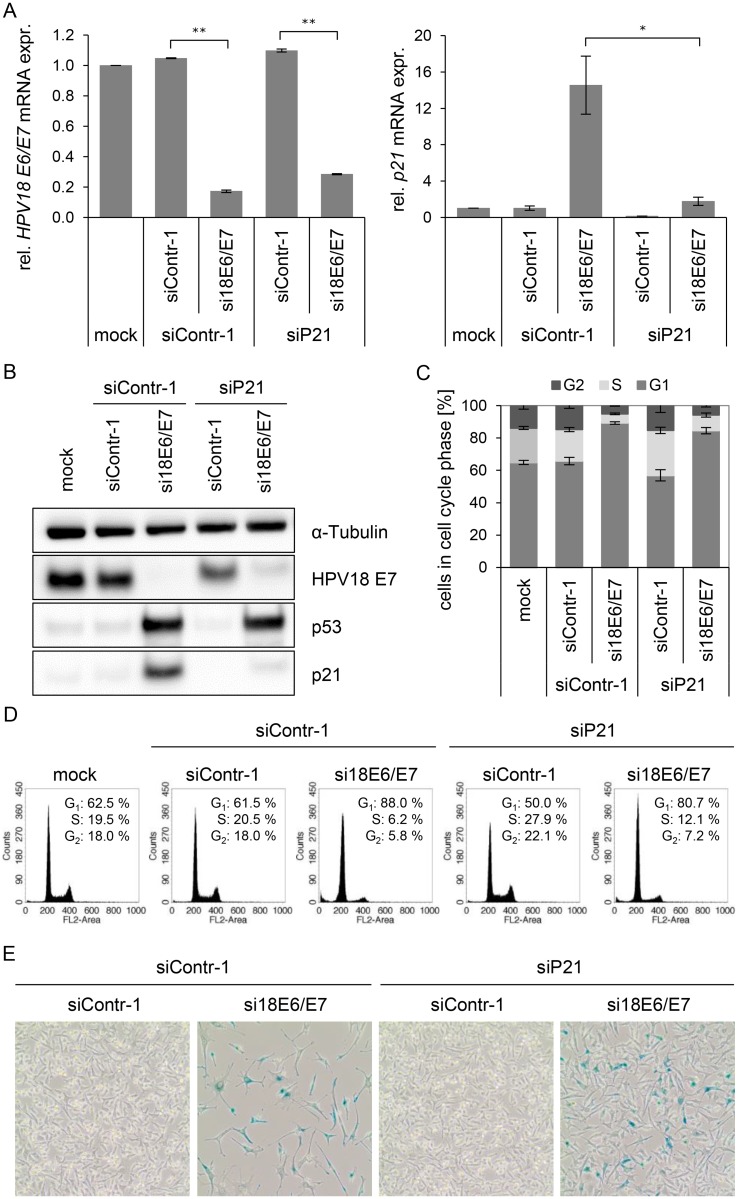
Fig 5. Influence of combined silencing of p21 and HPV18 E6/E7 expression on the senescent phenotype of HPV-positive cancer cells.
(A) qRT-PCR analysis of HPV18 E6/E7 (left panel) and p21 (right panel) mRNA expression, 72 h after transfection of HeLa cells with the indicated siRNAs or in mock-treated cells. mRNA levels were normalized to ACTB and calculated relative to the mock control. Data represent mean ± SEM (n = 2 or 3). Asterisks above columns indicate statistically significant differences between the indicated treatments (p ≤ 0.05 (*), p ≤ 0.01 (**)). (B) Immunoblot analysis of HPV18 E7, p53, and p21 protein levels, 72 h after transfection of HeLa cells with the indicated siRNAs or upon mock-treatment. α-Tubulin: loading control. (C + D) Cell cycle distribution analyzed by FACS, 72 h after transfection of HeLa cells with the indicated siRNAs or upon mock treatment. Percentage of cells in the G1, S and G2 cell cycle phases are indicated. Representative samples of one experiment are shown as well as a summary of multiple biological replicates. Data represent mean ± SEM (n = 3). (E) HeLa cells were stained for expression of the senescence marker SA-β-Gal, 168 h after transfection with the indicated siRNAs. Visualization by bright field microscopy.

