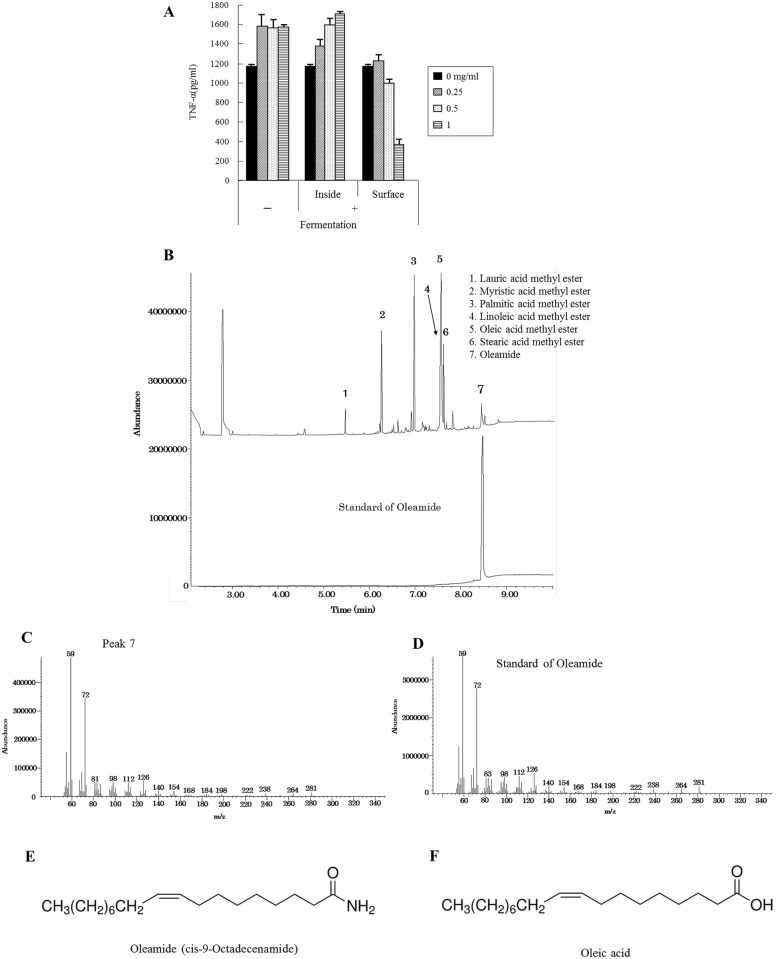
Fig 3. Lipid extraction and GC/MS analysis of extracts from the dairy product fermented with P. candidum.
A, Isolated microglia were stimulated with 5 ng/ml of LPS and 0.5 ng/ml of IFN-γ after pretreatment with each methanol extract, and TNF-α production in the supernatant was quantified by ELISA. Error bars represent means ± SEM (n = the number of cheese samples) B, Chromatogram of the extract from the surface of the P. candidum-fermented product and oleamide as a standard. C and D, Mass spectra of Peak 7 and an oleamide standard, respectively. E and F, Chemical structural formula of oleamide and oleic acid, respectively.

