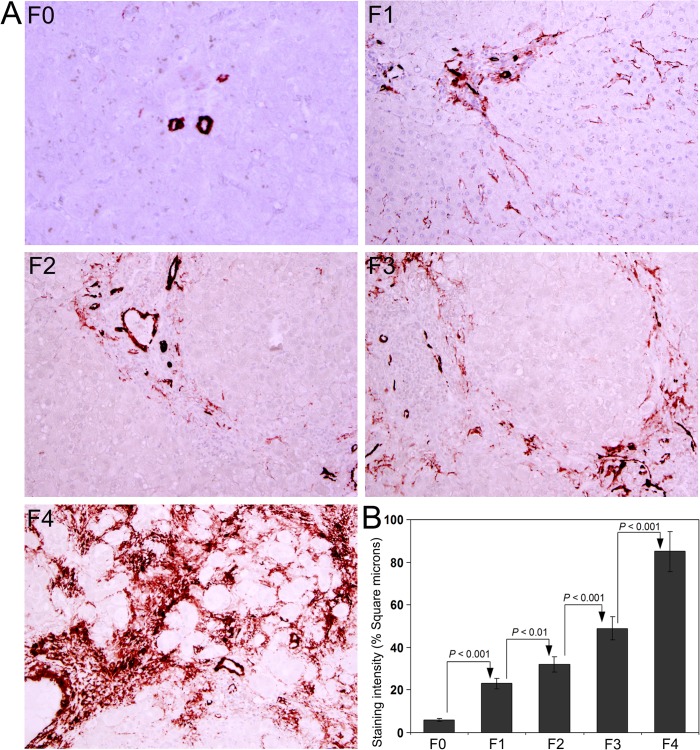
Fig 2. Immunohistochemical staining for α-smooth muscle actin (α-SMA) in the liver biopsy sections.
(A) The intensity of α-SMA staining in activated stellate cells coincided with the degree of fibrosis in F0, F1, F2, F3, and F4 group of patients with HCV infection. (B) Quantification of α-SMA staining. The data are mean ± S.D. in each group. Original magnification, x100.

