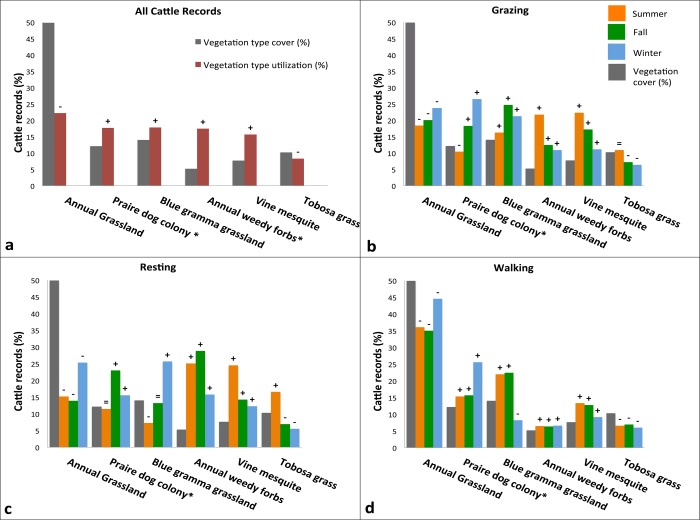
Fig 2. Large-scale experiment.
Cattle record’s percentage by vegetation type, activity, and season. a) Total time cattle utilized the different vegetation types v.s. vegetation type % cover; b) Grazzing records by vegetation by season v.s. vegetation type cover %; c) Grazzing records by vegetation x season v.s. vegetation type cover %. d) Grazzing records by vegetation x season v.s. vegetation type cover %. Bonferroni confidence-interval results (P <0.001) are given by the following signs: “+” indicates preference (utilization above availability); “=” indicates random (utilization equal to its availability); and “–” indicates avoidance (utilization below its availability); and “*” indicates vegetation types with significant differences in utilization across seasons.

