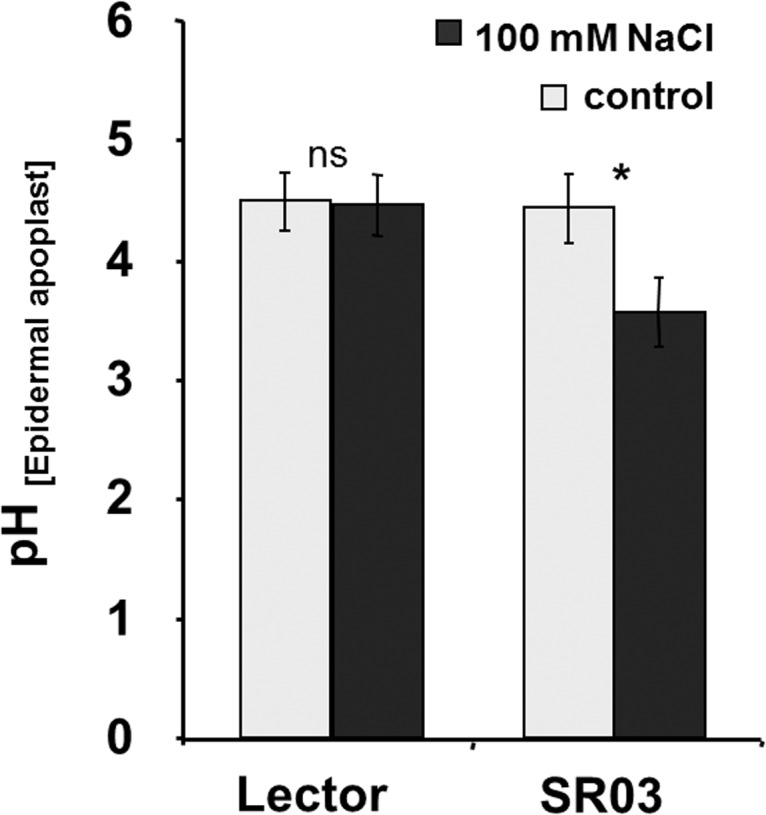
Fig 3. Effect of NaCl stress on the apoplastic pH in the leaf epidermal apoplast.

In planta quantification of pH in the epidermal leaf apoplast in a region that had emerged from the sheaths. Light-grey: control; dark-grey: 100 mM NaCl, duration: 8 days. Lector: sensitive hybrid; SR03: resistant maize hybrid. Measurements were conducted on 45 different plants, with 5 regions of interest. The data represent means ± SE. Asterisks indicate significant mean differences between salt treatment and control with respect to the proton concentration (*p ≤ 0.001; ns = not significant; t-test).
