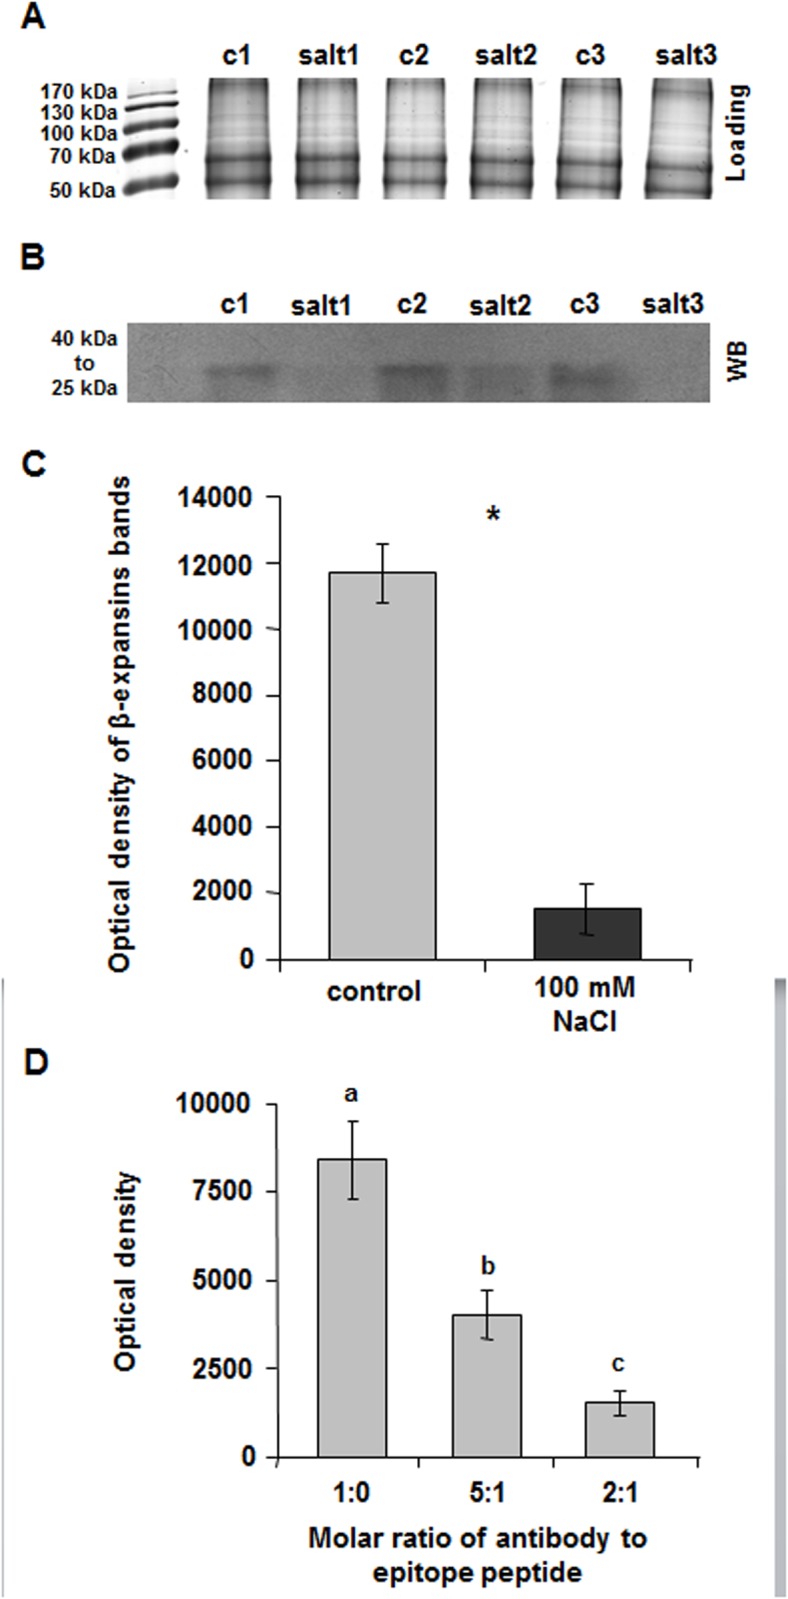
Fig 4. Western blot analysis of β-expansins in the epidermal cell wall of salt-sensitive Lector.

(A) Coomassie-stained controls of the Western blot shown in (B) indicate equivalent protein levels in all lanes. c, control; salt, 8-d 100 mM NaCl treatment. Numbers 1–3 indicate biological replicates. (B) Western blot detection of β-expansins in expanding leaves of salt-treated (100 mM NaCl) and control plants. β-expansin bands appear between 40 and 25 kDa. c, control; salt, 8-d 100 mM NaCl treatment. Numbers 1–3 indicate biological replicates. (C) Densitometric analysis (TINA 2.08 software) of Western blot bands shown in (B). Bands were plotted as the average of the optical density (OD). Asterisks indicate significant difference (*p ≤ 0.01). (D) Specificity test of immunochemical β-expansin labelling. To exclude that unspecific signals were erroneously detected by the anti-peptide antibody (anti-ZmExpB), the antibody was pre-incubated with the epitope peptide before 1D Western blotting. A molar ratio of antibody to added peptide of 2:1 almost completely blocked WB labelling (signal intensity: 1513 density/mm2-background). A molar ratio of antibody to added peptide of 5:1 reduced the labelling (signal intensity: 4028 density/mm2-background). Under normal conditions without pre-incubation of the antibody with the epitope peptide (ratio of 1:0 = non-adsorbed antibody), the signal intensity was 8413 density/mm2-background.
